WebChart sample

If you search the documentation, you can find the following example within WebChart:

Var sales() As Double = Array(345890.0, 421934, 456908, 567987)
Var ds As New WebChartLinearDataset("Sales", Color.Blue, True, sales)
Me.AddDataset(ds)
Me.AddLabels("Q1", "Q2", "Q3", "Q4")

WebChart has three objects to handle different graphics: linear, scatter, and circular.

From the three above, the ability to make the following graphics modes is derivated in Bar, Bubble, Donut, Line, Pie, PolarArea, Radar, Scatter.

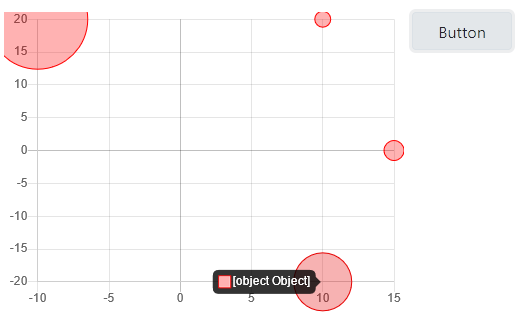
Does anyone have a similar code to the one-sample WebChar in the XOJO, documentation, related to WebChartScatterDataset?

set the chart mode in the ide inspector at chart control

Var p1 As WebChartScatterDatapoint = xWebChartScatterDatapoint(10,20,8)
Var p2 As WebChartScatterDatapoint = xWebChartScatterDatapoint(-10,20,50)
Var p3 As WebChartScatterDatapoint = xWebChartScatterDatapoint(10,-20,25)
Var p4 As WebChartScatterDatapoint = xWebChartScatterDatapoint(15,0,10)

Var sales() As WebChartScatterDatapoint = Array(p1,p2,p3,p4)
Var ds As New WebChartScatterDataset(Color.Red, sales)
Chart1.AddDataset(ds)

workaround because values from constructor was all zero^^

Var p As New WebChartScatterDatapoint(x,y,radius)
p.x = x
p.y = y
p.radius = radius

Return p

Ashampoo_Snap_Sonntag, 12. Dezember 2021_7h54m23s_002_Untitled - Mozilla Firefox

1 Like

Thanks for your reply, Markus.

This code format did not work for me.

For example, there is no xWebChartScatterDatapoint class in XOJO, with a leading “X” character.

Even fixing the above and following the logic to do work does not run what you show.

My guess is that xWebChartScatterDatapoint is:

Var p As New WebChartScatterDatapoint(x,y,radius)
p.x = x
p.y = y
p.radius = radius

Return p
1 Like

sorry, this is a method you use as workaround because if u use values in the constructor
they appear as zero. so i created the object and then assign the values.
the method return the WebChartScatterDatapoint

1 Like

Thanks Alberto and Markus !!!

1 Like