Web Load Testing Discussion

Recently I spent some time trying to determine how much load a Xojo Web app could sustain and figured I’d share my journey here with everyone. Let’s start with the setup…

DigitalOcean (DO) Droplet
Debian 12 x86
Premium AMD w/ NVMe SSD
1 GB / 1 AMD CPU
25 GB NVMe SSDs
Not the very bottom of the barrel ($4 as of this writing), but moved up to the Premium tier for better specs and throughput ($7)
Web apps loaded via Lifeboat with an nginx backend and no load balancing

Testing Location
I’m just doing this from home
MacBook Pro M1 Pro
Fiber 1GB although Wi-Fi to my Mac (802.11ac w/ Tx rate of 780 Mbps)
I’m about 100 geographic miles to the DO data center
Be aware that this is not normally how you would do in depth load testing where you’ll have multiple (hundreds/thousands) of clients geographically dispersed to add load to your web app.

Testing Product Selection
There’s lots of tools out there from jMeter to Locust, but ultimately I wanted something I didn’t need to invest a lot of time in although I knew this would limit my results. I started with hey before I found its successor, oha. The big plus here is that there’s a precompiled binary and you don’t have to go off using make or creating a bunch of dependencies for Java, Python, etc. Note for anyone who’s not a terminal person, both hey and oha will download a binary that won’t run on the Mac until you “chmod +x ./oha” to set the executable bit.

Testing Methodology
I ended using the example Eddie’s Electronics web app that comes with Xojo. Note that you’ll find it within Samples Apps/Eddie’s Electronics.

I’m not sure how much caching if any DO or nginx is running out of the gate, so I wanted to do the test “warm” as this is the most likely real world scenario. So this means I did one test run that was discarded and took the result from a second one.

Of course I was curious, so I ran this test across Xojo 2019r3.2 (Web 1.0), 2023r4 and 2024r1.62274. Be aware that only the latter two Web 2.0 products are directly comparable but it’s still nevertheless interesting to see the contrast with Web 1.0.

Per the oha recommendations, I ran the following command to test things out…

./Downloads/oha -z 60s -c 100 --latency-correction --disable-keepalive https://myserver.com

Note that they did recommend doing a -q but I don’t believe Eddie’s Electronics is using queries so I disregarded this command.

Results
Here are the terminal results from each of the runs…


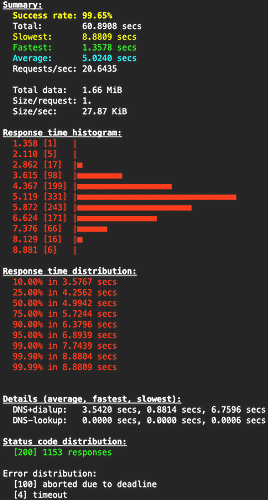
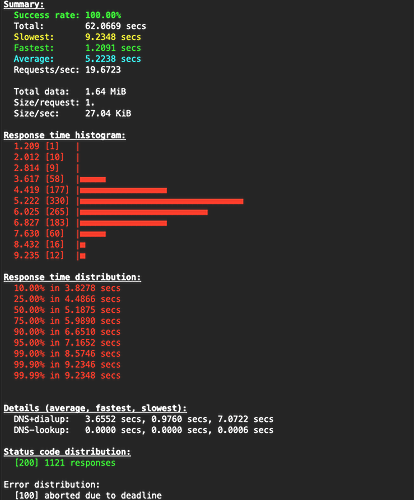
Xojo 2019r3.2 (Web 1.0)


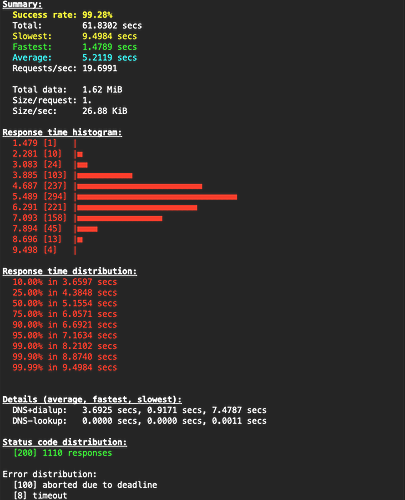
Xojo 2023r4 (Web 2.0)


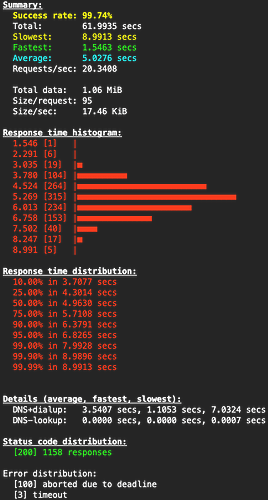
Xojo 2024r1.62274 (Web 2.0)

Discussion
So the first thing to call out is probably the first deficiency here of the testing just hitting the home page and not navigating through the interface at all. As a result, the findings aren’t going to be super conclusive beyond how quickly or reliably the homepage loads.

The first thing that stands out, is how different Web 1.0 is from Web 2.0. Not only is the size/request drastically down under 2.0 but the size/sec is higher which should mean much better efficiency and throughput versus 1.0. Of course the caveat is that the total data size is greater under 2.0, but I think this has to do with the project itself being different than 1.0.

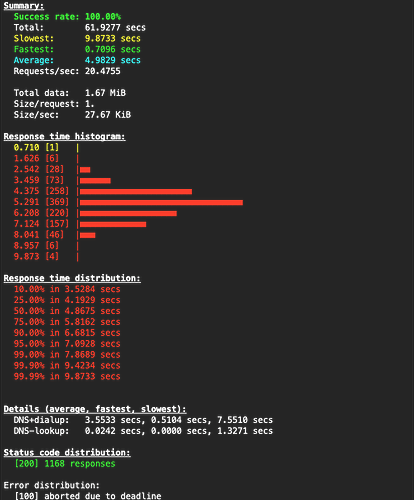
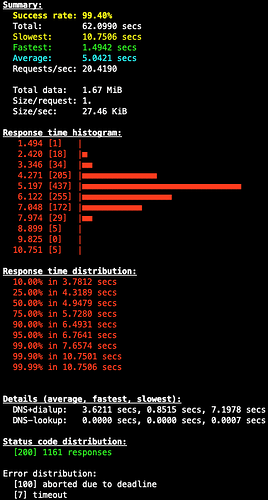
Next it looks like the requests/sec are about the same across all three tests, although 2023r4 did have slightly more timeouts. Note that the “aborted due to deadline” isn’t an error per se, but how many connections were ceased once the 60 sec test time was up.

It’s also interesting to see a majority (75%) of all requests happening in the low 5 sec range across all tests with the slowest and fastest times about the same for all.

Next Steps
So on my side, I was more curious than anything else about how much load 2.0 could take. In this very rudimentary test, it appears that having 50 concurrent users hitting the homepage of Eddie’s Electronics at the same time, is very doable. Next step for me might be to crank up the number of requests and concurrent requests on my own web app to see if I can gauge at what point I should move up to higher tiers of DO droplets, add more load balancing, etc. At the very least, I now have a baseline that I can work against.
5 Likes

This is really good stuff.

As a followup, @Ricardo_Cruz has some really great data using wrk.

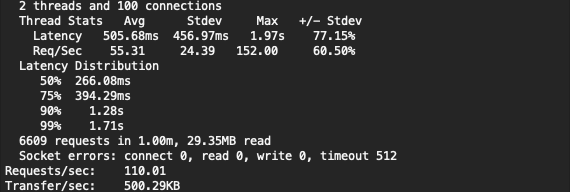
Just for kicks I just ran wrk versus oha to see the comparison. One important thing to note is that oha is in active development and is “newer” with more UI than wrk.

./wrk -d 60s -c 100 --latency https://myServer.com
./oha -z 60s -c 100 --latency-correction --disable-keepalive https://myServer.com

There are some deltas since my initial posting in February…

DigitalOcean (DO) Droplet
Debian 12 x86
Premium AMD w/ NVMe SSD
2 GB / 1 AMD CPU
50 GB NVMe SSDs
Now at a higher premium tier ($14 as of this writing).
Web apps loaded via Lifeboat with an nginx backend and no load balancing

Xojo
Web 2.0 app compiled under 2024r1

Mirroring my prior test runs, here is what wrk versus oha looks like…

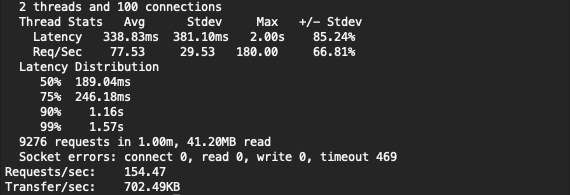
wrk
wrk 2024-05-13 at 2.17.51 PM 100

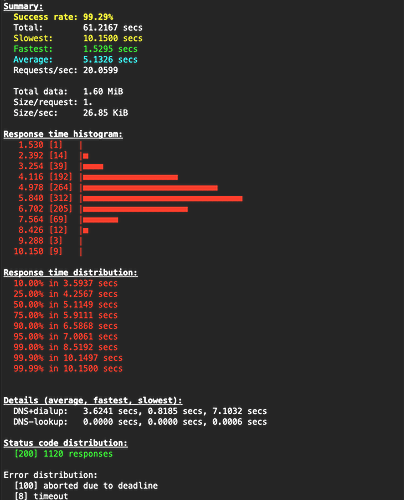
oha

What’s particularly interesting here is how different the results are from each tool. For example wrk shows 154.47 requests per second versus oha at 20.0599. wrk also shows 469 timeouts versus 8 under oha. wrk shows 9276 requests versus 1120 responses under oha (which matches up to 20.0599 requests/sec * 60 seconds). The latency and response times are all over the place in comparison to the two tools. Some of this might come down to what’s being loaded up as wrk shows 41.20MB read versus oha at 1.60MiB so maybe wrk is loading up the whole web app but oha isn’t. But this also doesn’t make sense as wrk is showing better response and throughput than oha.

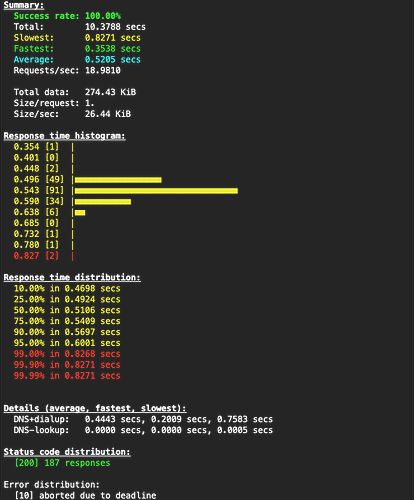
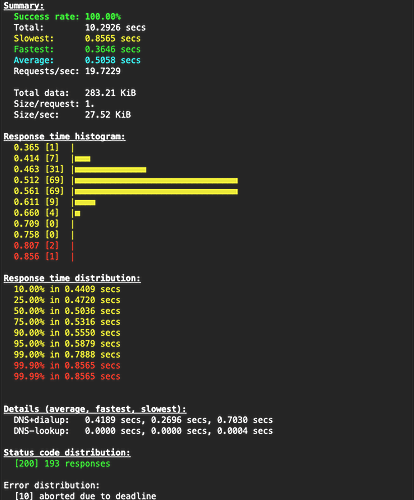
For comparison with Ricardo’s own data in the other thread, here’s two more runs, but this time with the duration and connections reduced to 10…

./wrk -d 10s -c 10 --latency https://myServer.com
./oha -z 10s -c 10 --latency-correction --disable-keepalive https://myServer.com

wrk
wrk 2024-05-13 at 2.19.34 PM 10

oha

The same analysis as above, appears to hold true here as well. I think the big take away isn’t to try and rectify the deltas between these two tools, but instead that one should pick a single tool and then stick with it to capture the positive or negative deltas over time as the analysis methodology will be consistent then.

This does continue to beg the question of, “What exactly is the throughput of Web 2.0 and how many users can a server sustain in burst as well as normal operations?” Of course, lots of variables feed into these questions and all these load tester tools are theoretical in nature so there might never be a fully accurate number here.

3 Likes

I haven’t heard about oha before, but it looks really nice. Both oha and wrk are useful. It seems (without haven’t played with it yet) oha is more a stress tool, while wrk is focusing on throughput.

Thanks for sharing this.

2 Likes

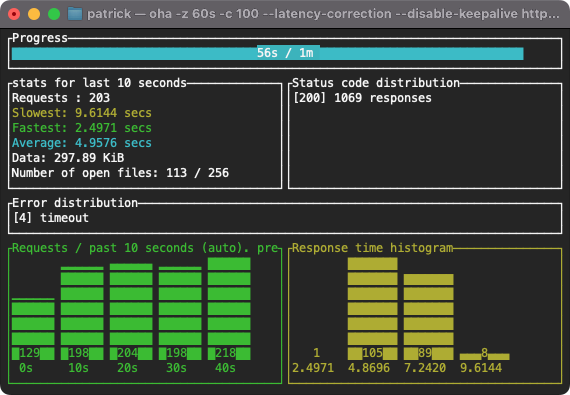
Also although I haven’t posted a screenshot for this yet, oha has a very nice real-time “dashboard” so that you can see the status while things are progressing. All the screenshots above are from the “conclusion report”, and here’s an example of the “dashboard”…

oha
Screenshot 2024-05-14 at 11.18.01 AM

3 Likes

One new update… I went to run some more tests today and discovered my URL path was incorrect from the May 13, 2:52 PM post. Here are updated results run today using the proper path. Some results are very similar but things do appear to be running faster and also slower in spite of today’s workload being heavier with the proper path. But this speaks to and is a great example of how there never are any correct or right answers in that there are lots of variables at play from say DO’s servers being more heavily/lighted loaded and of course all kinds of potentially different network conditions. Instead these are snapshots in time under conditions that will likely never be 100% comparable with past or future conditions.

wrk
Screenshot 2024-05-26 at 1.55.46 PM 100

oha

And here are updates for the 10 second results.

wrk
Screenshot 2024-05-26 at 1.56.18 PM 10

oha

the stats for a non-tech person looks not bad, in laymans terms what is this - ok, good, superb, bad, worst – sorry to be blunt

I wish I could say and could tell you. This is my first Web 2.0 app (although in the past I’ve done many Web 1.0 ones). Over time there might be some better indication but in general I’m seeing this more as a directional indicator to see the performance trend Web 2.0 is on. From this aspect, Ricardo and team are doing great as things are indeed getting better over time.

But back to my original root cause to do this work, I’m hoping that over time I’ll be able to use this data to determine and adjust my DigitalOcean (DO) infrastructure when needed. For example I have a snapshot in time with numbers and subjective “feel” to the app performance. I’m hoping that I’ll be able to set a threshold in respect to this data where I’ll be able to eyeball at what point I’ll should enhance my DO infrastructure due to user load and maybe even code changes.

I know I’m not alone in this quest and this should be a well trodden path for many. Can anyone out there running Web 2.0 apps provide their own best known methods for performance analysis, Cloud infrastructure thresholds, etc?

It’s ‘meh’ and it’s predictably meh. Overshadowing any Xojo code you write are the attributes and performance limitations of Xojo itself. In laymans terms, the executables the Xojo compiler turns out are not suited to performant and scalable network servers. Too much CPU, too much latency and too few threads.

In the 1 minute wrk test Xojo managed to transfer ~5Mbps (being generous). That’s a mere 1/20th of a 100Mbps low bandwidth server connection.

Of course not every web app needs to compete with Google.

In comparison to other web technologies, especially when you’re talking about scaling large, this is indeed very true. Xojo Web 2.0 has other positive attributes that make up for this such as potentially faster development and shared cross platform code/logic. Of course everyone has their beverage of choice and we should be glad there are so many to choose from.

Actually this is a bit of a lark as this is dependent upon the website you’re loading and testing against. At least for me and the one I’m testing, it’s relatively small and is mostly a single 49KB png and a form. So 5Mbps is actually pretty reasonable considering how little footprint there is in this app. Using a different URL with a more sizable load and logic would probably put the Web 2.0 and framework to a much more thorough test.

My app is currently pre-production and has no user load. So at least for me, the oha and wrk load testing is to mostly capture a baseline so that I can see the delta under more normal user loads to determine at what point I need to further scale my VPC, load balance my app, potentially land in other regions, etc.

I don’t think it’s about favouritism but the right tool for the job.

I’ve got a couple of Xojo web apps in my office that have been running a couple years. One is to encourage the staff to record the right information when they take phone messages, and automatically attaches the caller’s number after extracting it from the the phone system syslog messages. The other provides an interface for the SMS function on our 4G backup router for sending passwords and centralising MFA requests. The apps are not pretty and they don’t do much but what they do is incredibly useful and saves the business many hours per month. Each of the apps was taken from inception to production in less than a day. Less time than it takes me to set up a PHP development environment. I have 5 staff at most so performance is not an issue. The apps sit on our NAS and are reverse proxied from the same NAS.

The blunt answer to the blunt question, in laymans terms how performant are Xojo web apps? Is however, meh.

I would not wait to reverse proxy a Xojo web app. Plan it from the start. Connect Xojo to the proxy with HTTP and have the proxy do the HTTPS. It saves the proxy waiting on Xojo to encrypt it’s responses using a single thread.

Since Patrick is using Lifeboat, this is the configuration that is being tested.

1 Like

I think we’re touching on something rather important here. When we’re talking about performance, it’s often in comparison to something, whether it’s other products, other versions or even a moment in time.

I completely agree, Xojo Web 2.0 isn’t going to have the performance of other web technologies out there. If someone is looking purely at web performance, then Xojo is not going to win any of the top spots.

But if you look at Xojo’s performance in respect to between versions, from a baseline with no customers to production with customers, etc., then there’s intrinsic value in tracking performance regardless of how Xojo Web might fare within the greater industry.

Alas @Wahed_Qadri’s query wasn’t very specific as to whether they were looking for a performance analysis to my own data or Xojo Web 2.0 in general. As this thread is specific to my own data and isolated to between versions and moments in time, my own reply went this direction.

So to extrapolate and answer for each direction, I personally wouldn’t place a meh value on Xojo 2.0 as this is contextual. If you’re working on the next Twitter app with hundreds of millions of users, then meh or worse might be the appropriate answer. But as I think we’re both in agreement of using the right tool for the right job, Xojo Web 2.0 will likely be used in scenarios such as your own from a handful of users to maybe tens (hundreds?) of thousands of users. In this scenario, then I’d personally give it at least an ok if not good, but I won’t know more until my app goes live publicly.

For the other direction, of performance between versions, snapshots in time, etc., I would personally provide a good to maybe even suburb rating. Improvements are happening and the trend is going the right direction. There haven’t been huge gains here, but as you also noted, there’s only so much Ricardo and team can likely do, due to inherent limitations within Xojo itself, its internal architecture, etc. Figuring out ways around these limitations and having big performance gains is what would put it squarely in the suburb rating for me. But the mere fact that there are so many things for the Xojo team to take on and that Ricardo continues to focus on performance since joining the team, is what dials things up slightly from the good to maybe superb rating.

You do bring up an important point in that performance should be something thought about in advance. As Tim mentioned, I’m indeed using Lifeboat so at least one lever for improved performance has been set. I’ve mentioned there are other levers that can be used to improve performance and the user experience as well. Hence why I’m capturing performance data so that I can determine at what point I need to invoke one or more of these other levers which increase overall financial costs.

I received a question as to whether HTTP/2 is enabled in nginx within Lifeboat for these tests and what kind of impact that might have. It is indeed enabled as is gzip compression.

Here’s a back to back test between HTTP/2 enabled and disabled (gzip compression enabled for both). Per my prior testing methodology, I’m running oha “cold” once, then running it a second time “warm” to try and eliminate any caching deltas. So these tests were four runs with the second from enabled/disabled captured. Total start time delta between the captures is about 60-90 seconds.

Quick analysis shows that having HTTP/2 enabled does indeed help performance, but not greatly for my own app. But every bit helps and cumulatively each improvement adds up. Not having HTTP/2 enabled does show some timeouts though, but I’m not seeing this as notable as I’ve had prior runs on other days where HTTP/2 has gotten a handful or two of timeouts during the run.

HTTP/2 Enabled

HTTP/2 Disabled

Your reply began, “I wish I could say and could tell you.” [Whether the numbers are good or bad.] I thought I might provide the view of those numbers from Operations. (I have to smile every time I post and Tim inserts an advert for Lifeboat.)

Your OHA test manages to serve around 1200 responses in 60 seconds. One instance of the Eddie’s home page consumes 80 responses. Which is 15 pages a second. Sufficient for a small departmental intranet or a niche application on the public web. Should 1000 people ever find the page at the same time you can expect a string of complaints.

The version comparisons do not reveal the sort of step change needed to make a significant difference to end users. The mean response time remains stubbornly around 5 seconds regardless of compiler and HTTP version. Look at the outliers within your test results. A 100ms gain here or there will quickly become indistinguishable within the inherent variability of a production network.

As I said this is not at all surprising. The foundation of a Xojo web app is the ServerSocket class with it’s blocking I/O on the same [OS] thread as the code you supply and everything else that happens in Xojo land. The performance limitations of ServerSocket are baked-in to every Xojo Web app and they are significant. Failing to recognise those limitations at design time sounds like a fast path to ’
throwing money at it’ trying to mask them in production. Those ‘levers’ as you call them come with their own sets of costs and problems.

To describe a Xojo Web app’s performance as anything better than ‘meh’ would leave me feeling dishonest. I don’t consider this to be criticism of the product, the team behind it or your testing efforts. It is (merely) an observation of what it is. The product has a lot things going for it but performance and scalability just aren’t some of them.

1 Like

I’m sorry, but I just have to strongly disagree :blush:

There are a lot of things being included in 2024r2, and performance improvements will be part of them.

You’ve mentioned about blocking I/O and that’s one of the pain points that were improved in Xojo Web, for the upcoming release.

4 Likes

Yes, great.

Now explain how Patrick’s numbers are not, ‘uninspiring’.

BTW I made a mistake in my earlier post. I said 15 pages per second but it’s actually 15 pages per minute. My apologies. These are not the orders of magnitude I am used to.

Gravy tomorrow :wink:

If that has been solved why isn’t available to other project types?

It’s his benchmark. I don’t know if he’s using 2024r2 beta, but I’m sure he’ll keep experiencing performance improvements, as he already saw. There could be a bottleneck in the path he’s testing, but that’s not an overall issue.

It definitely won’t take 4 seconds to render a response, that’s far from what I can see.

The Web framework in 2024r1.1 (the current version) is already able to serve 1000~1200 requests per second. This is using a single instance, serving some plain text or a JSONItem converted into String, through the HandleURL event.

With 2024r2, which is already available through the beta channel, that number jumped to 9000+ requests per second. Same test project, without modifications.

These are just benchmarks we’re doing to keep improving performance in different fields. The numbers can vary depending on the server specs, but the trend is there.

ServerSocket and TCPSocket, which Xojo Web uses, were already capable. What has been fixed is the Xojo Web server, to avoid blocking on I/O.

6 Likes

It’s all in the thread.

It’s 4 seconds per PAGE. About 20 responses a second. The page is the Eddie’s Electronics home page.

So what have you done, copied Node?

Trigger’s Broom