Here’s the latest refreshed data. To see the latest beta data, see the other thread within the Testers category.
SERVER SETUP
DigitalOcean Droplet
Debian 12 x86
Premium AMD w/ NVMe SSD
2 GB / 1 AMD CPU
50 GB NVMe SSDs
Premium tier ($14/mo. as of this writing).
LIFEBOAT SETUP
nginx backend
No load balancing
Instances: 1
Max Req. Body: 1M
Manage --UploadPath: Off
Enable gzip compression: On
Enable HTTP/2: On
XOJO SETUP
For each Xojo version I opened the example project…
Sample Apps » EddiesElectronics » Web
Xojo Cloud Target: Turned Off
Linux Cloud Target: Turned On
LOAD TESTER SETUP
Each load tester was run twice with data captured from the second run.
The intent was to capture a “warm” run rather than “cold” one in case there’s any kind of caching at play.
PERFORMANCE METRICS
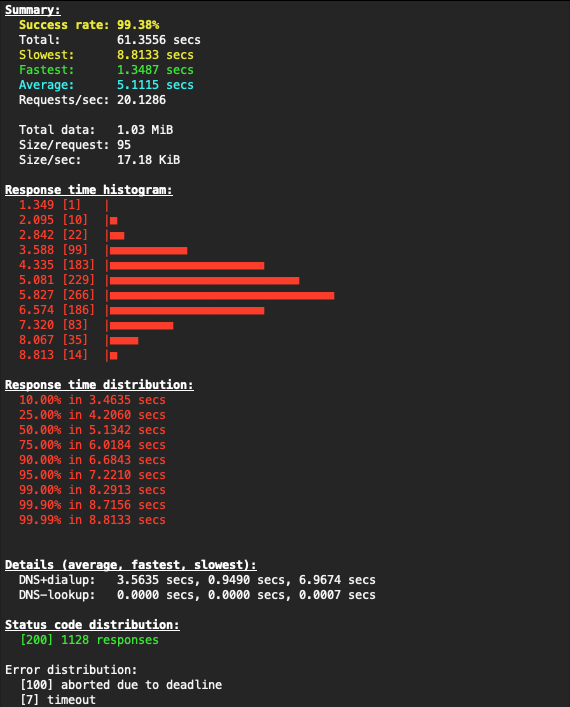
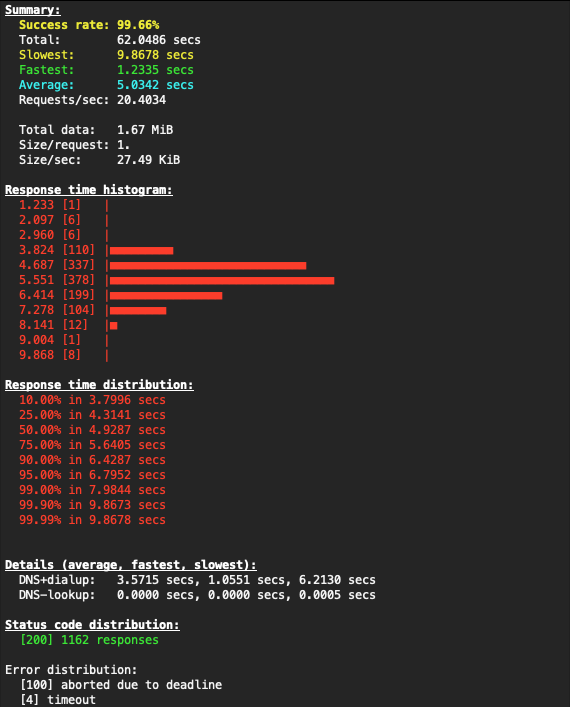
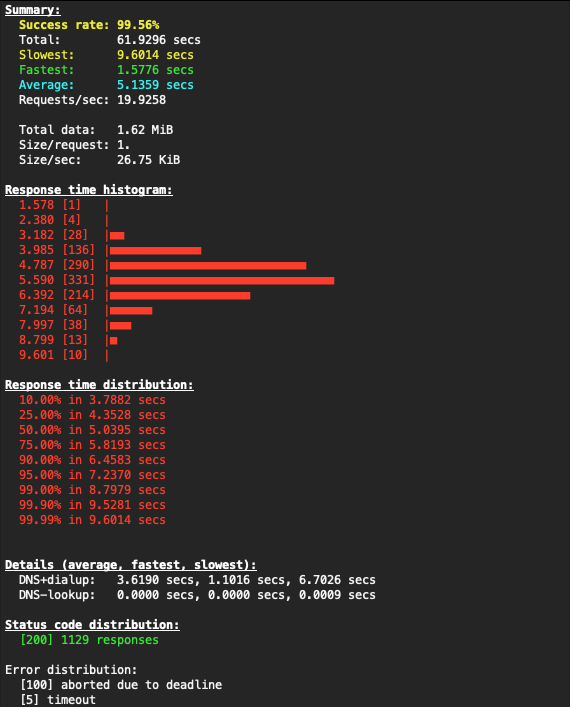
oha
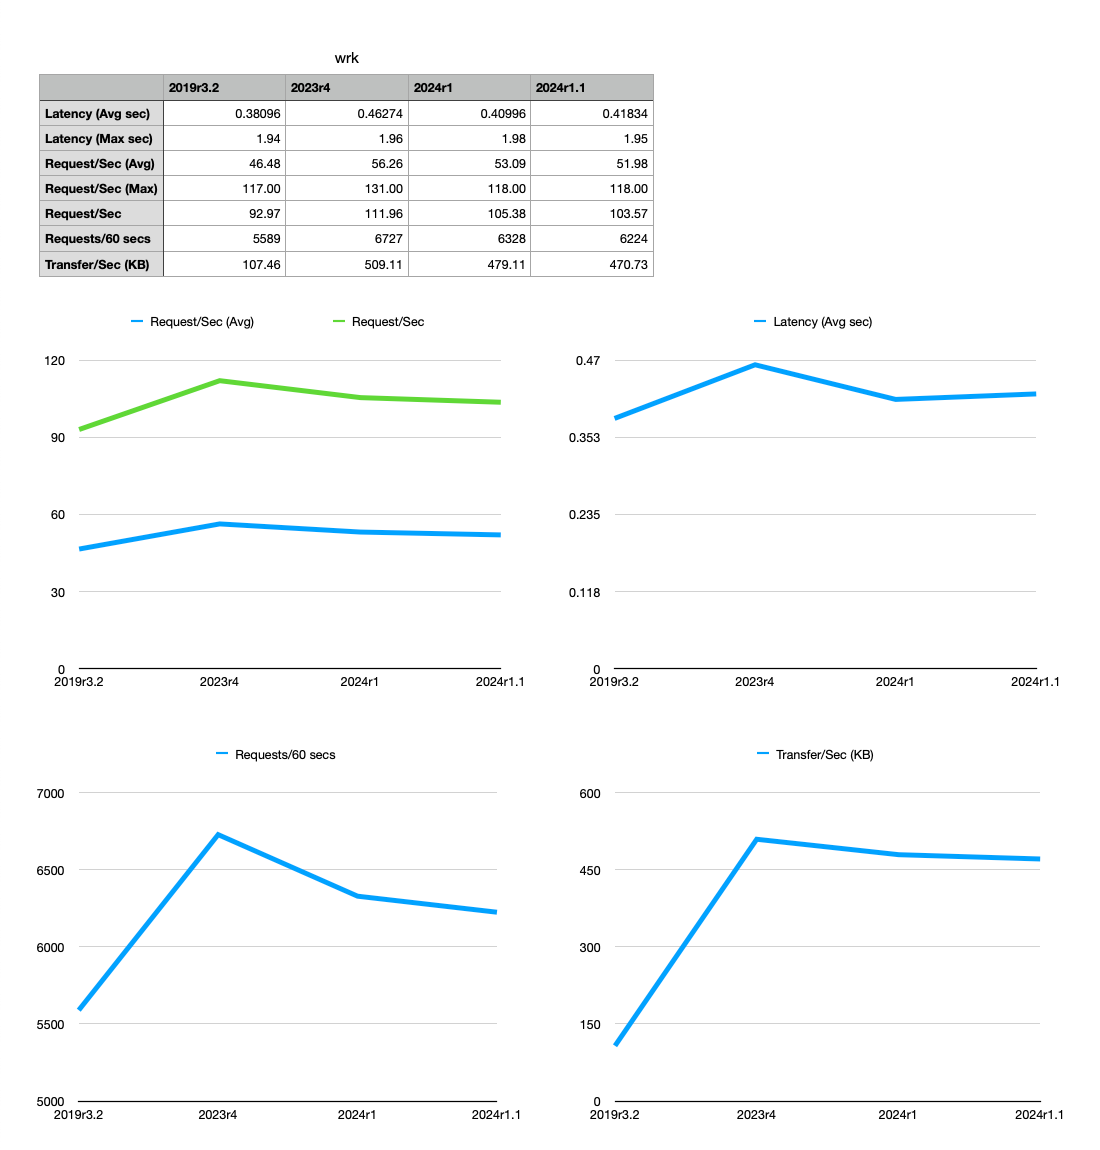
wrk
ORIGINAL DATA
2019r3.2
oha
wrk
2023r4
oha
wrk
2024r1
oha
wrk

2024r1.1
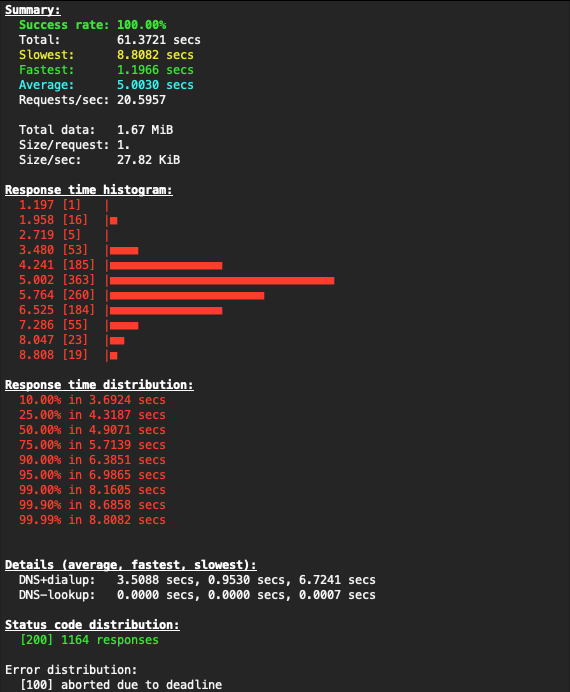
oha
wrk

NOTABLE ITEMS
The first thing to call out is that under 2019r3.2, Eddie’s Electronics was only stable when running on debug mode on my Mac (M1, Sonoma 14.5). As soon as the binary was placed on the server, Eddie’s Electronics would run but as soon as the web page was fully loaded, it would immediately crash. Not likely a big deal as we just care about loading the page and assuming each load tester was able to do so for each connection, the data should be solid, but take this data with a grain of salt. But mind you as this is Web 1.0, this data was mostly captured to try and extrapolate the performance gains that Web 2.0 brings to the table.
The other notable item is that although I did attempt to capture data with the --http2 flag for oha to force HTTP/2 connections, this switch didn’t appear compatible with the other options so I didn’t pursue this further
The final thing to note is that just for kicks, I attempted to load Eddie’s Electronics in a browser while each load tester was running (not during the data captures above but separate runs). This was very interesting in that during the oha runs, the website was still very responsive with very quick page loads…
Firefox
Web Developer Tools » Network (Disable Cache Enabled)
- 1.45s, 108 requests
- 1.46s, 108 requests
- 1.38s, 108 requests
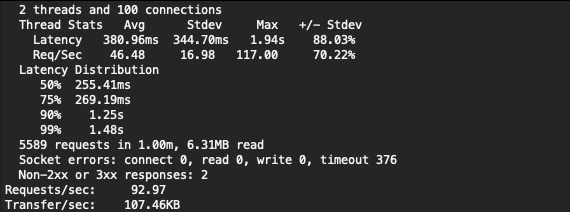
wrk on the other hand effectively makes the server inaccessible during the runs and I was unable to get Firefox or even Safari to load up Eddie’s Electronics at all until wrk finished. But mind you I was doing all of these actions from the same Mac and from a data capture perspective to isolate things better, these tests should have been done on a different computer and even a different network.
So just to validate things a bit further, I tried loading up the page on Safari on my iPhone via cellular. Alas wrk was still such a heavy load on the server, the page once again refused to load until the test completed.
ANALYSIS & THOUGHTS
So although some of my analysis on the prior/incorrect data was incorrectly placed, my overall thoughts on small but incremental improvements still stand. Things are getting better and the choking point in this analysis might not be with the Xojo Web 2.0 server itself, but maybe something else such as SQL or maybe disk I/O. Regardless, things are still headed in the right direction.
To Matthew’s point about load times of 5 secs being meh, yes, I would tend to agree. But I’m also not convinced that it’s 5 secs to load based upon my cursory load in a web browser while oha was running with <1.5 secs load time. Maybe oha is having problems finding the final page load time due to requests intermittently being sent thereafter.
I would also agree with you Matthew regarding throwing money at performance bottlenecks. But alas, Xojo Web 2.0’s performance is what it is. If there is a bottleneck in the ServerSocket class, there’s not much we can do about it over here on our side other than scale out server resources to compensate. If there are other ways of mitigating this that I’m not thinking of, I’d love to hear from others. I know there’s many out there that have specialized in Xojo Web Development apps, so what are your best known methods here? What is missing in our discussion?
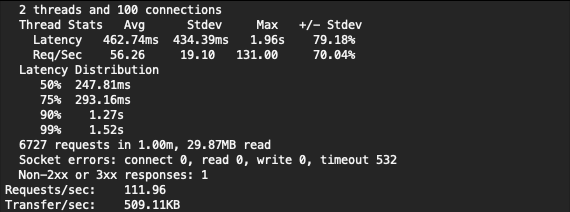
He also raised a solid point in that if wrk is showing 6224 requests/60 secs, then that means that the page only gets loaded 57 times in a minute (108 requests to load Eddie’s Electronics), which definitely adds credence to his analysis of “meh.”
But this also circles back to the discussion we’ve had about using the right tool for the right job. As I mentioned, Xojo Web 2.0 isn’t going to be the next Twitter, serving hundreds of millions of users. But for small to medium sized projects it should be a solid option depending upon architecture and the other positives that Xojo brings to the table (e.g. fast development times, shared code with other projects, etc.)
@Ricardo_Cruz It would be great to get your thoughts on all of this. On one hand maybe Eddie’s Electronics isn’t the best project to performance test against, but on the other hand, this is exactly the type of app that many Xojo users will be using Web 2.0 for. Also not to go too much into the weeds, this might be a valuable exercise in of itself to capture real-world best known methods to improve performance for Xojo Web Developers.