If Only My Maths Classes Had not Been That Boring (aka recalculate coordinate positions)

Sometimes an easy tasks turns out not be that easy at all – even more when you confuse yourself with formulas. Hope someone can help me untie my synapsis jam:

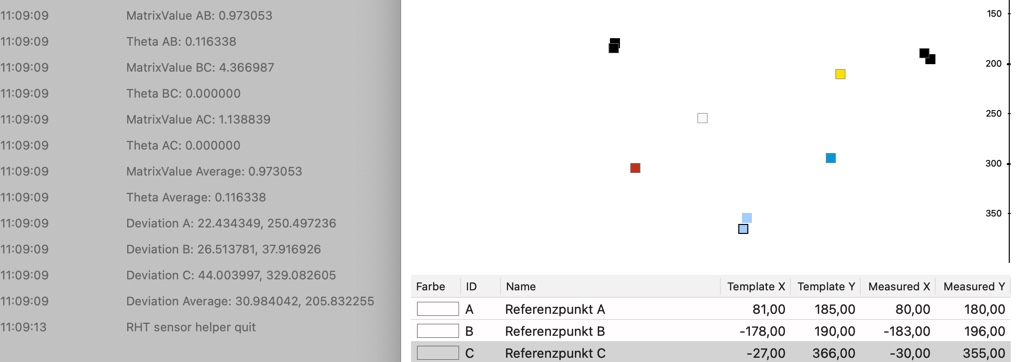
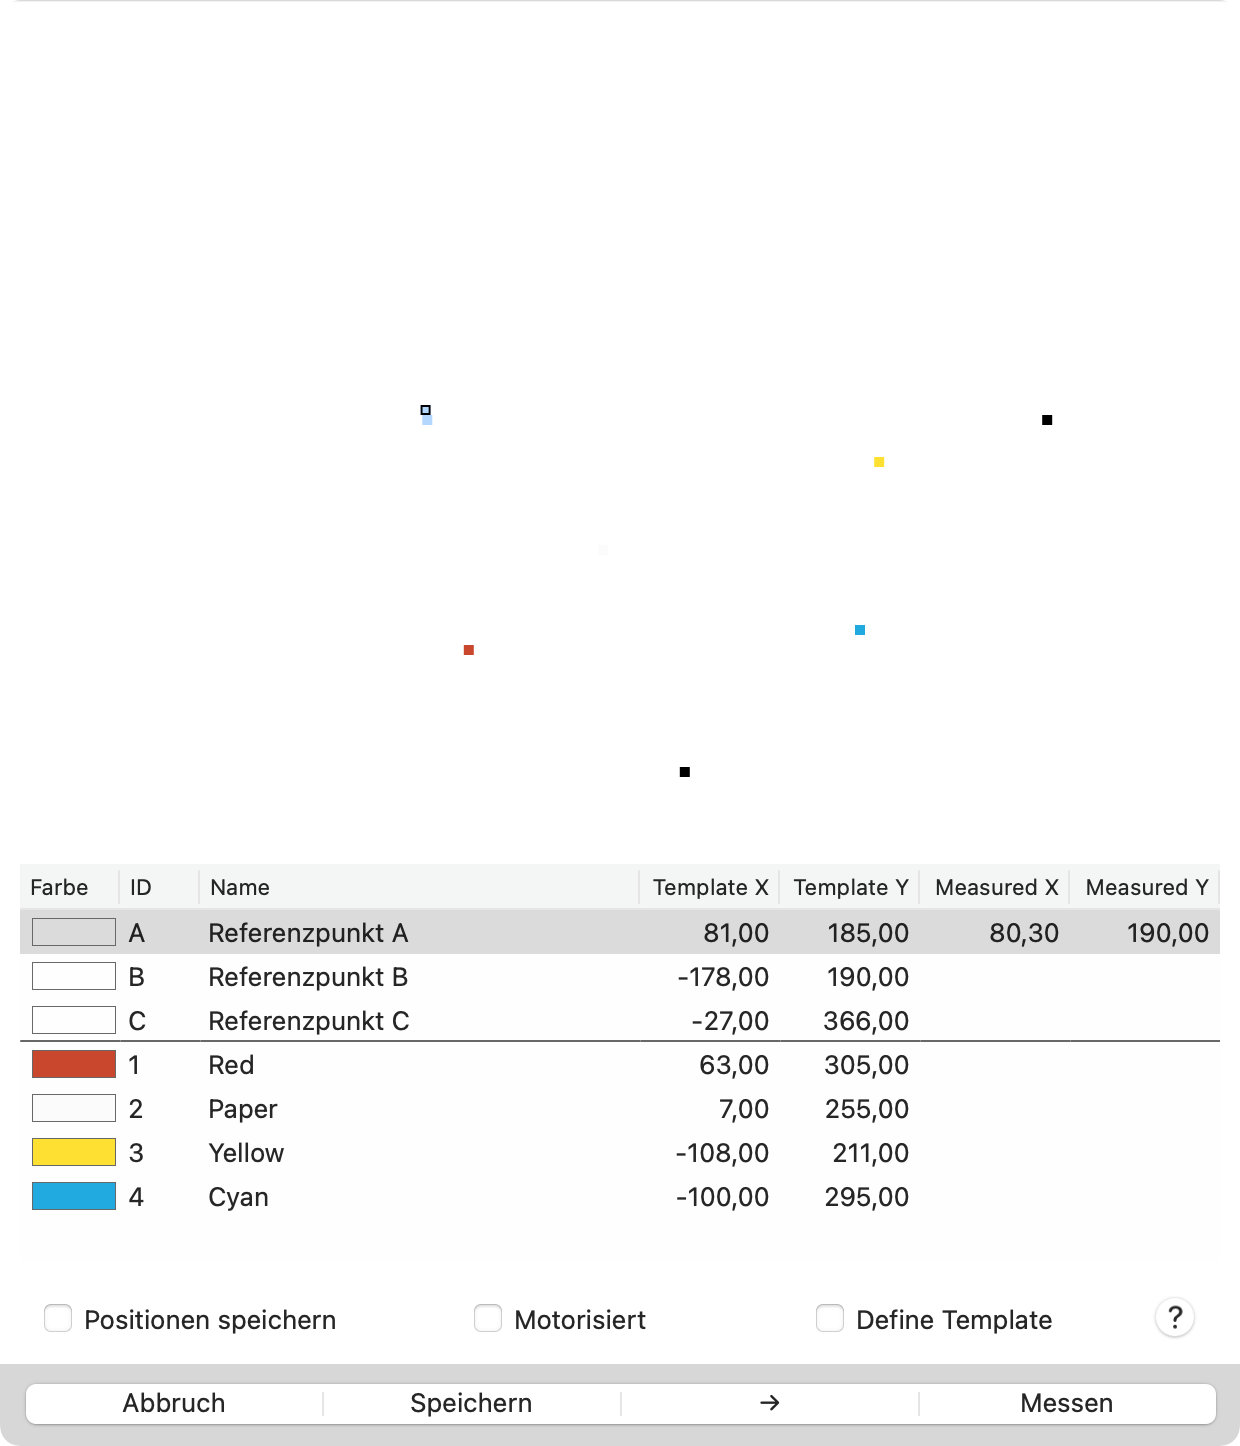
I have a list of coordinates, representing patches on a piece of paper. The three first points are random reference points, the others color patches to be scanned. TemplateX/Y are the positions on the original template, measured those taken from the current print.

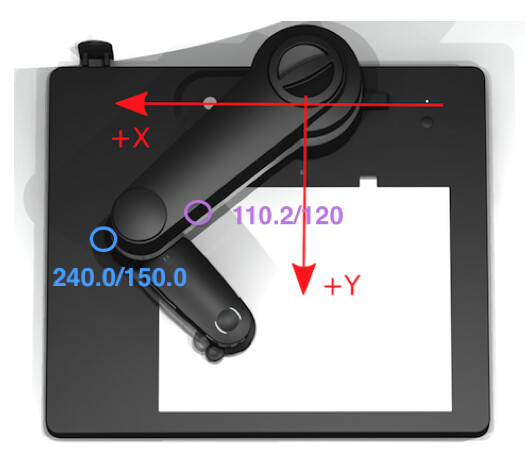
The coordinate system used by the instrument is a bit weird, rotated and mirrored vertically, with x increasing to the left and x = 0 somewhere in the middle. But that should not matter, I guess. Just to explain why the selected reference point A (blue with black border in the upper left) is a bit higher and more to the left than its measured values (light blue without border directly below the first spot in the picture).

Of course it will not be possible for an operator to mount the template exactly each time, so the idea is to analyse the transformation mask and apply that result to the patches, so any necessary translation, rotation and maybe small scaling will be applied to them.

Bad point is my maths are up to the point of working with right angled triangles. The reference points are not, or at least do not have to be. Any hint to a good place to start or even more?
Thanks a lot!

Capto_Capture 2021-03-14_05-55-35_PM

I haven’t a clue what you mean with your explanation. What is a patch? What is a template? What do you want to do?

You have measures values in one coordinate system (A, B, C). Now you have to change the coordinate system for red, paper yellow and cyan?

I think what I need is to figure out the transformation matrix built from the reference points against their measured values, and then apply this matrix to the other coordinates which in reality are color patches on a printed paper. The template is the original printout with which the original coordinates (template x/y in screenshot) have been designed.
Only – how? I found some papers on this but feel like lacking one or two academic degrees to grasp them.

Sorry, please be more precise: what is this supposed to be? Do you only have one point for measuring?

No, I have three reference points for measuring. In the screenshot Point A is selected, and its real position is shown (Measured X/Y).
The user should now also define the actual (“measured”) positions of reference points B and C. They are the black squares in the graphics, so they can be quite random and do not necessarily form an ideal (right-angled and enclosing the other points) triangle.
Once their measured values haven been defined, I wish I knew how to calculate the transformation matrix that maps the triangle built by the xy “template” reference points to that built by their measured points.
This matrix should then be applied to the coordinates of the colorpatches 1–4 (Red to Cyan).

Thanks for your assistance! Could I make myself clearer?

I think I basically found the solution. If I would understand it. Instead it keeps taunting me with quotes like
“and I believe you know how to solve that” :weary:

Can anyone give me a hint how to translate this into code?

I agree with Beatrix. There is no ‘real world’ description of what you are trying to do here.

Let us guess:

On paper, there is a dot. It is at position 100,200
You use this arm to tap on it, and the co-ordinate is different … maybe 120,200

if that is the end of it, the co-ordinate is either scaled or translated.
Scaled means the difference between real and measured will change on a sliding scale the further you move the arm.
Translated means the difference is constant… x is always 20 different.
To know, you need to take at least 2 measurements.

To arrive at NEW X from OLD X, you need to apply a constant plus a ratio.
NEWX = c + ?x

Same for the y co-ordinates.

These take care of translation and scaling.

Rotation is a world of pain that I couldnt begin to explain from first principles, but will entail consideration of x and y. to get new x, and x and y to get to new y

Enough new x,y. and old x,y comparisons will lead to being able to derive the the centre of rotation, and the angle of rotation.

Thanks, Jeff. Well, that’s why there are three reference points, not only one, which ideally should be furthest away from each other and form an enclosing triangle to the color coordinates I want to scan.
Theoretically, it should be possible to calculate a transformation matrix from that, but the formulas I found so far are way above my head, and mostly without any hint how to code them.

Maybe I should try to map their deviations from the original points and use the extrapolated value for the color coordinates. They are usually not that small, so this could work out.
I was hoping for a more exact solution anyway.

If I understand your problem correctly, you have three reference points that define the coordinate system, A, B and C. They are on a template and you add to that template other points (your patches), of which you need to know the position with respect to the template’s coordinate system. But, you are scanning (I presume) this drawing and the coordinate system of your image is obviously not equal to the one of the template, so you need to convert the image positions (your measured positions) to the ones expressed with respect to the template’s coordinate system. Is this correct?

If it is, can we consider the rotation will be small (below 90 º)?

I have found a solution to your equation system but it generates an ambiguity in the result because the cos theta = cos (-theta), but since sin theta <> = sin (-theta) we need to know whether it is a positive or negative rotation. If we can be sure the rotation angle is always small its sign can be checked independently.

1 Like

Hi Julen,

yes, you got me 100% right. I’m not exactly scanning that image; it is a project for a color measurement device which can do only spot “scans” – it analyses the color of the specified color patches whose positions have been defined beforehand – the template x/y patch positions.

This window was initially built so that the operator can adjust the patch positions to reality. As it is almost impossible to install a page exactly inside the instrument’s scan bed each time, the operator could move the arm to each color patch first and feed the current positions. Which is pretty awkward of course, and so the wish to only detect the reference points and do the calculation of the color patch positions by the reference points.
Hence, only small deviations are to be expected. The template must not be mounted in a different orientation. There will usually be no scale factors being involved, and rotation/translation will be in the normal range of “human alignment” – a few mm, very few degrees.

I tried a solution which sounds a bit like what you propose: Determine the angle between one of the lines built by a side of the reference triangle and calculate the angle and magnitude towards one of the color patches, then use this value to recalculate the position by the measured deviations. That did not work well for me – the recalculated positions were somewhere in the wild but not where I expected them.
If you have an idea how to make that work, I’d be very happy.

Your three reference points (A,B and C) have two sets of coordinates, one per system. A would be (x_A,y_A) on the reference system of the emplate and (x_Am, yAm) on the measured coordinate system (the same for B and C). x_t and y_t give the translation between the two origins of the coordinate systems, theta is the rotation angle. We need to determine x_t, y_t and theta to define the conversion matrix. We apply the conversion matrix of your link to A, B and C:

(1) x_Am*cos(theta) - y_Am*sin(theta) + x_t = x_A
(2) x_Am*sin(theta) - y_Am*cos(theta) + y_t = y_A

(3) x_Bm*cos(theta) - y_Bm*sin(theta) + x_t = x_B
(4) x_Bm*sin(theta) - y_Bm*cos(theta) + y_t = y_B

(5) x_Cm*cos(theta) - y_Cm*sin(theta) + x_t = x_C
(6) x_Cm*sin(theta) - y_Cm*cos(theta) + y_t = y_C

We can combine them now:
(7) = (1) - (2)
(8) = (1) + (2)

(9) = (3) - (4)
(10) = (3) + (4)

We get rid of x_t and y_t:
(11) = (7) - (9)
(12) = (8) - (10)

and combine them again:
(13) = (11) · (12)

You can arrange the resulting expression in order to end up with cos(theta)^2-sin(theta)^2 on one side and another term that depends on x_A, y_A, x_Am and y_Bm on the other side, let’s call it K:
K=((x_A-y_A)-(x_B-y_B))*((x_A+y_A)-(x_B+y_B))/(((x_Am+y_Am)-(x_Bm+y_Bm))*((x_Am-y_Am)-(x_Bm-y_Bm)))

and
cos(theta)^2-sin(theta)^2 = K

cos(theta)^2-sin(theta)^2 = cos (2*theta) = K

you can get theta from there as: theta = 1/2*arccos(K)

NOTE 1: As you mentioned, all this can be replaced by a dot product between two vectors defined using the coordinates of the same two points expressed on the two systems. The advantage of the approach above is that since you are getting the cosine of 2*theta, I believe the error will be reduced, and that could be important if theta is small. I could be wrong and the dot product method would be much simpler to implement and debbug.

NOTE 2: Since cos (theta) = cos (-theta), we don’t know the sign of the obtained rotation angle. The only way I could come up with to know it is to compare the slope of the two vectors defined by the positions of two points (A and B, for example) in the two reference systems.

NOTE 3: I haven’t tested any of this :upside_down_face:

EDIT:
Once theta is known take equations (1) and (2) and extract x_t and y_t from them:
x_t = x_A - (x_Am*cos(theta) - y_Am*sin(theta))
y_t = y_A - (x_Am*sin(theta) - y_Am*cos(theta))

And hopefully your conversion matrix will be ready to be used for any other point.

Julen

2 Likes

In calibration systems, not only rotation, but also scale and displacement need to be taken in account, from the “stored” calibration base points (template) and physical equivalent read points. Sometimes, from point A to point B in the X axis, the stored data we have a delta of 100, but when “reading the real thing” the delta could appear as 120, meaning that in the physical reading there’s a 20% scale increase that needs to be addressed in the transformation too. Same for Y axis. Also the initial displacement. The far left X could be 0 in the calibration sheet and when reading it we find 17 or -8 for example. Do you remember the old resistive touch displays? We needed to touch the 4 borders and the center because in each device we find different numbers.

1 Like

The math concept you are looking for is called a transformation matrix. Julen above has covered the math, if not the conceptual underpinnings. :slight_smile: Here is a good site to begin with, with live examples and code:

https://www.mathsisfun.com/algebra/matrix-transform.html

It might also help you to normalize the coordinates to a system that makes more sense to think about.

Displacement has been taken care of, as for scale:

But if it fails, misses the point, probable there’s scale problems. Let’s wait and see.

Thanks a lot, all! Especially of course @Julen_I. I will try to adapt your proposal into code and let you know how well it works.

Thank you for considering this. This is a project used in print industry. If they don’t get the scale right their problems are deeper than only color management. But yes, basically I agree, and if it should still fail in some cases, reconsider adding scale changes too.

… which I had been looking for, but all explanations found so far had been that scientifically that I felt somewhat belonging in Kindergarten. Fun fact is I know and love mathsisfun, but for reasons unknown I had only found triangulations based on dot product which did not work well.
Good to know they have something on the Matrix too. I’ll take the red pill and dive right in. Thank you!

without a matrix its separated into
sub/add a value to translate move a x,y point
multiply a value to scale up or down a x,y point
this cos/sin thing mentioned above just rotate around a “center”
if you add 3 x,y points together and divide by 3 then you get the middle x,y position.
the vector length (between 2 x,y points) is also very useful.

After some tests with manually entered values: The “matrix factor” calculation works nicely. I added BC additionally to AB and the results match.
But: The angle calculation is too mathematically strict. Once the deviation between two measured points does not match exactly, theta will become NaN. Because we rely on manual localization of the measured coordinates, a certain tolerance has to be expected.
Do you have any idea?
(And thanks a lot again!)

That must be caused by a K larger than 1. if theta is almost 0 and, as you say, the measured values have a certain error, that could give you values of K > 1, but the arccos function is limited to a (-1,1) range.

Without seeing the actual values that are giving you trouble, the only solution I see is checking for K > 1 and setting theta to 0 in that case.

Otherwise, maybe it would be better to use the dot product route. I can help you with that too, if necessary.

Thanks a lot again, Julen!
I added calculations for AC too now, so I have three possible values and can either build an average (for those K – in the log “MatrixValueA,B,C” – are <=1) or assume theta = 0 and average them all.
But the xt/yt values – “Deviations A,B,C” in the log – cannot be true, or can they and I still don’t understand how to extract them and project one of the color patch coordinates correctly.