I’m running Xojo 2019r3.1. I upgraded to from Windows 10 to Windows 11 and I’m now having problems running Windows applications in the IDE.
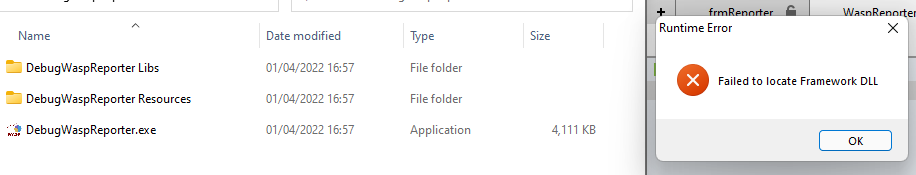
When I press the “Run” button, I intermittently get “Failed to Locate Framework DLL”. The message comes up maybe 50-60% of the time. The rest of the time, the application runs as expected.
I’m running Windows Defender Firewall and Security. I’ve tried turning off the firewall and real time protection but this makes no difference.
I have no problem running web applications in the IDE.
If I build the application and run it as an EXE, it runs fine.
I can’t upgrade to the latest version of Xojo because I still have to support users using IE11 (not for much longer hopefully)
I’ve read all the other forum posts about this problem, but I can’t see anything relevant to my problem.
Any suggestions welcome as this is hindering my work.
@Jeff_Tullin thanks for the quick response. No, the build folder is on my local drive and is not shared or on OneDrive. I am using Git but I was using that on Windows 10. And the builds are excluded i.e. they are in Git.Ignore
Crazy things may appear as result of some antivirus interfering in “suspicious” actions like some process as Xojo writing new executables and libraries. Check you antivirus systems and actions, whitelist Xojo if necessary. A second worse possibility is an infected machine and virus action. The 3rd one is “some never seen behavior started to show up with a new release of Win 11”.
@Rick_Araujo I’ve tried turning off the firewall and anti-virus real time checking, but that makes no difference. Xojo is whitelisted and I’ve also added the debug.exe as an exception. This makes no difference.
Also, my colleague upgraded his PC to Win11 and is not having any problems. The main difference between his PC and mine is I’m using Bitlocker. Could that be causing an issue?
I agree with @Rick_Araujo here, in my experience with situations like this it is has always been AV that is quarantining the file for some reason.
I don’t see how Bitlocker could be causing this issue as it is whole drive encryption and is not concerned with individual files. I’ll flip it on on one of my Window installs to make sure, though.
You might also try creating a new user account to see if the problem also happens there. This can sometimes help narrow down an issue.
@Rick_Araujo Ok, I’ve unistalled Xojo and reinstalled it. Nothing has changed.
I’ve had a look in the Windows Event Viewer and can’t see anything that relates to the Xojo error.
The fact that it’s intermittent is confusing. If something was blocking access to the Framework, wouldn’t it do it all the time? It feels like a timing issue.
Not the first time I see bugs related to timing in Xojo, so may be. But I also saw crazy random things like the defunct line component that sometimes became diagonal at runtime, only sometimes, varying from one compilation to another, so who knows?
Or still “being copied”, not released yet, but the system tried to launch it anyway? Some kind of asynchronicity? An encrypted filesystem is slower than a raw one.
What happens if you untick the ‘Launch executable after receiving’ checkbox on the Remote Debugger window, start a debug build and when the IDE has finished transferring it across, you double click the debug executable manually.
@kevin_g I’m not setup to do remote debugging. But, if I click “Ok” on the “Failed to locate…” message and wait, the IDE does go into a debug state. If I then run the EXE from the debug folder, the EXE runs, and if I place a breakpoint in the code, the IDE breaks on the breakpoint!
Not sure what that tells us, but it looks more like a timing issue in my opinion.
(BTW, End of play here in the UK. Thanks for everyone’s help)
Further to my previous post, If I click Ok on the "Failed… " message and immediately run the EXE from the debug folder, the EXE runs connected to the IDE in debug mode. In other words, if I get the “Failed …” message, I can ignore it and then launch the EXE manually. This is a pain, but is an improvement on the situation.
I would still like to get this sorted, so does this information help?
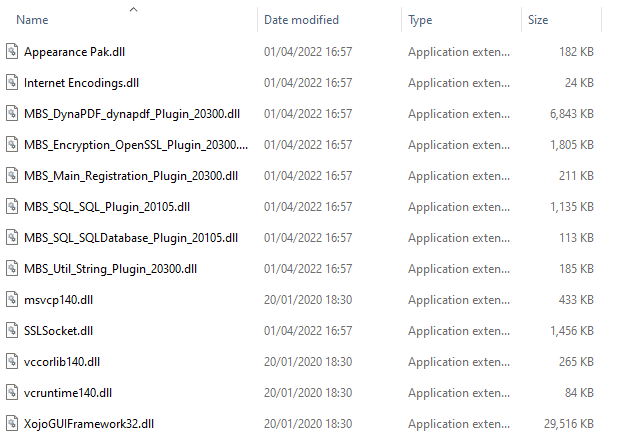
Your screenshot indicates the file is there, so this does now seem more like what @Rick_Araujo mentioned and perhaps that framework DLL (the largest of them) has not yet finished copying. Perhaps Bitlocker is slowing things down just enough on your system for this to happen sometimes.
Please create a case for this and include a link to this forum topic so we can look into it further.
Have you started the ide in admin mode (could cause trouble if this is other than user context) or compatibility mode?
have you once deleted the whole output folder?