I have found a set of GPS coordinates and I want to draw the Polygon for one.
The set holds 12 different values just like:
-0.8835,-0.44377, 44.73008, 45.04764
So I used the FigureShape exmple and three fx.AddLine([data set]) but I see nothing o screen.
I changed the Scale value, x,y values, tried to eat my hat, and a night after that I am like when I started: nowhere, excepted that I can confirm, these are a set of GPS values (no internet @ night).
Some help is welcome.
PS: I added a Vertical ScrollBar to change the fx.Scale value… no change. When I set the two original fx.AddLine(…) I get the original triangle.
And at this time, I heard on the radio The Beatles singing “Help ! I need…") 
By any chance all coordinates are negative?
Mind to share a snippet with your data?
Thank you for your answer Richard.
No, positive; I am at the east of Greenwitch (continental Europe). The coordinate above are for Bordeaux, but I do not found the OpenData file(s). France is -0.something (near Atlantic ocean) to 7.something (for eastern continental)
I have to find another set of data to be sure the one I have is correct (as I said: no internet @ night).
I will do.
PS: I even moved the decimal point to one digit because the difference between x,y and x1,y1 is small, very small. Nothing on screen (but I do not reboot. Sequoia effect ?)
How does your Color setup look like? Border/Fill color, opacity?
This shows nothing on screen:
Var fx As New FigureShape
fx.AddLine(0, 100, 50, 0)
fx.AddLine(50, 0, 0, 0)
//fx.Border = 100 ' opaque border
fx.BorderColor = Color.Red
fx.FillOpacity = 0
g.DrawObject(fx)
I used 2021r2.1 / today I fired 2024r3.
Example from 2024r3:
Var fx As New FigureShape
fx.AddLine(0, 100, 50, 0)
fx.AddLine(50, 0, -50, 0)
fx.Border = 100  ' opaque border
fx.BorderColor = Color.Red
fx.FillColor = Color.Yellow
g.DrawObject(fx)
and I see hal of the triangle with red border and yellow inside. This is the code from Sample (FigureShape) I used (but update to be current).
Set in the Paint event of a Canvas.
So you’re using the same color/opacity setup with your data?
Maybe best to upload a project snippet with your data then…
Example of GPS values for Bordeaux.
There is no project per se. Only a window, a Canvas and the code I disclosed. I take the set of values from an OpenData file not meant to be disclosed. I will continue my quest to find another set that can be shared. (OpenData they said and the .csv url was not exposed, but in comments in the html file !)
I found another set of data (as csv, using ; as field separator) CSV link.
Look here for more data (and the link have a time zone in it (Europe Berlin).
More files to be downloaded, etc.
Well, these are just numbers.
But remember that gps co-ordinates are SMALL numbers.
So the position of my house and the one 3 doors away is a number where the integer part is the same, and the decimal value varies.
eg mine might be 53.525623 and theirs may be 53.525434
If you treat these as pixel co-ordinates, thats the same pixel on screen, unless you scale way up.
Using this code (made up values starting with some GPX file for Tenerife and changing one or two numbers to make them bigger…)
I do get something visible on screen
Var fx As New FigureShape
fx.AddLine(28.0449735 ,-16.710835, 28.04500227549 ,-16.710859463404)
fx.AddLine(28.04500227549 ,-16.710859463404, 28.04503105098 ,-16.710883926809)
fx.AddLine( 30.04503105098 ,-45.710883926809,28.04505982647 ,-16.710908390213)
fx.AddLine( 28.04505982647 ,-16.710908390213,40.045347581369 ,-30.711153024256)
fx.AddLine( 40.045347581369 ,-30.711153024256,28.0449735 ,-16.710835)


fx.Border = 100  ' opaque border
fx.BorderColor = Color.Red
fx.FillColor = Color.Yellow
g.DrawObject(fx,100,100)  //note the offset - this puts the starting position on screen
Thank you Jeff. Here’s what I get:

And, yes, you are correct for the values. I moved the decimal character to 1 number to the right (*10) with no visible result.
I add a verticalscrollbar to change the scale value: no result; but the scale value changed drastically (I checked in the debugger).
I definitely have to read another set of coordinates. What I have is meant to be PolyGon definition (unlike Bordeaux shared above who talk about Points. I will come back when I found another set of OpenData.
Yeah. We need to see your actual co-ordinates.
If you get a result using mine, you should see a result using yours.
But if you multiply the co-ordinates by 10, then you are looking at values like - 100 and + 570, which may not be on your screen.
No, the properties are below 50, so - even below 500 will be good (screen is 3360 x 2100 if memory serve); I used a temp pict and check in the debugger but saw nothing.
I will resume work on that this evening. Usually that goes better with a break (when time allow).
I notice that some of your values are repeated in the fx.AddLine (and I do not think mine are). That bothered me this night. But so many digit, so old eye to read them / tired …
If you want to plot a shape, the lines need to join up.
a to b
b to c
c to d
d to a
If you have GPS co-ordinates that track a path, you might be using
A to B
C to D
E to F
and never actually forming a shape.
It seems that the culprit is the file I used. I found a different set of locations and it works. To be clear, here’s my code and an entry for a different location (France south-east); and also a screen shot of the result (surprising image).
- The Code (from a Canvas.Paint Event):
Sub Paint(g As Graphics, areas() As REALbasic.Rect) Handles Paint
  // ********** ********** ********** **********
  //
  // Xojo code based on Xojo 2021r2.1, FigureShape example
  //
  // 2024-10-17 & 2024-10-18
  //
  // ********** ********** ********** **********

  // Initialize the FigureShape
  Var fx As New FigureShape

  // a. Border Properties
  fx.Border      = 100       // opaque border (sic)
  fx.BorderColor = &cFF0000  // red border
  fx.BorderWidth = 1

  // b. Fill Properties [useless]
  fx.FillColor   = &cFFFF00  // yellow interior
  fx.FillOpacity = 100       // Opaque inside

  // c. Other Properties
  fx.Scale = 150

  // d. Set what to draw (Next line: the original data)
  // {"type":"MultiPolygon","coordinates":[[[[6.714194,43.7402332],[6.7142085,43.7402958],[6.714125,43.7403099],[6.7141107,43.7402455],[6.714194,43.7402332]]]]}
  fx.AddLine(6.714125, 43.7403099, 6.7141107,43.7402455)
  fx.AddLine(6.714194, 43.7402332, 6.714194, 43.7402332)
  fx.AddLine(6.7142085,43.7402958, 6.714125, 43.7403099)
  fx.AddLine(6.7141107,43.7402455, 6.714194, 43.7402332)

  // e. And Draw the Object
  g.DrawObject(fx, 200, 150)
End Sub
-
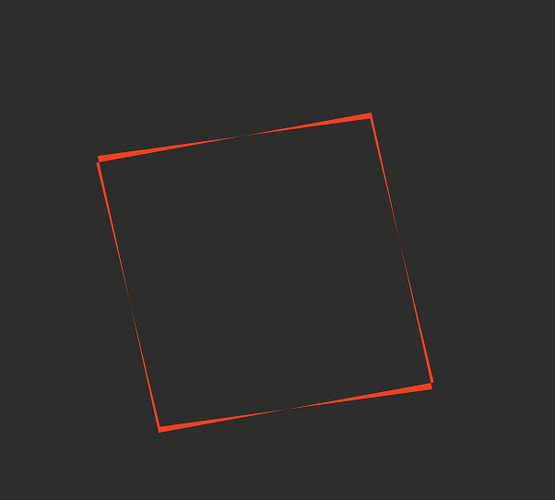
The (surprising) resulting screen shot:
-
Because there is no ID in the entry, I cannot verify if my drawing is correct. The quest continue.
Thank you all.
BTW: I do not wanted to take the values from a json suffixed file and was searching a csv (who at last used ; as a separator, a small annoyance) and I ended with a json file. I had to add a Return before {"types to have something that is human readable.
The other city data files ends with geojson, gpk, and shp. I only used the hidden .cvs file. I will check the other lately, just in case…
When I take your data, I make this from it:
fx.AddLine(6.714194,43.7402332, 6.7142085,43.7402958)
fx.AddLine(6.7142085,43.7402958, 6.714125,43.7403099)
fx.AddLine(6.714125,43.7403099, 6.7141107,43.7402455)
fx.AddLine(6.7141107,43.7402455, 6.714194,43.7402332)
And that draws like this:
What is it that you are expecting to see?
In data for other cities, there is a field called n_parcel (plot of land nbr) that allow the user to know where in the city map (in the .csv data) the gps numbers correspond. Not in that case.
I tried some kind of variation from the original values, but only the originals do something.
Description of one original “land”:
{"type":"MultiPolygon","coordinates":[[[[6.714194,43.7402332],[6.7142085,43.7402958],[6.714125,43.7403099],[6.7141107,43.7402455],[6.714194,43.7402332]]]]}
The other coordinates looks similar (longitude, latitude and brackets).
Maybe the Scale factor I used was too small…
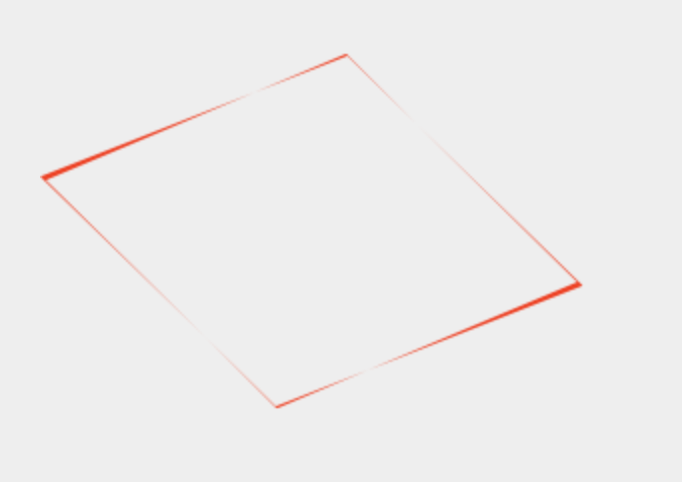
That was it, the result with fx.Scale = 150 (original values) is:
 .
.
Why the line size change is probably a Xojo bug.
I will try with a know Land map / set of data and be back with the results.
Well, you have 5 co-ordinates.
The first and last are the same, forming a closed loop.
You are looking for at best , one of these shapes:
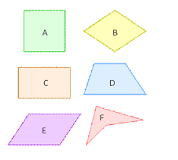
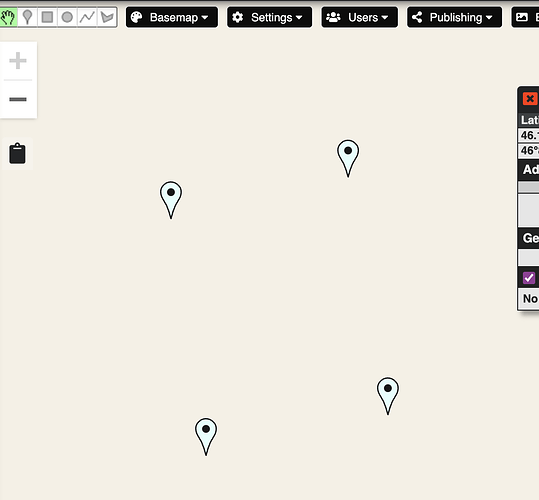
and plotting those points on a map without joining them together, shows this arrangement:
Maybe investigate GraphicsPath to display ?
Good idea. WIll try if the current is not working.
From a know map/definition sets, here’s:
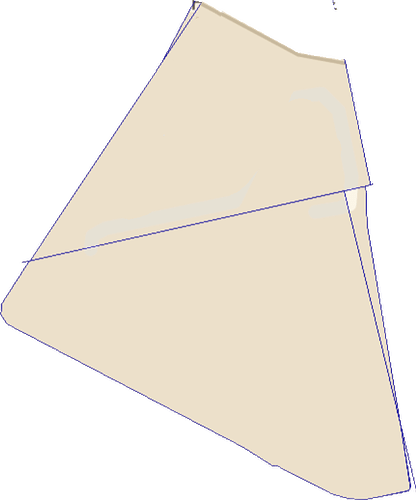
Original map:
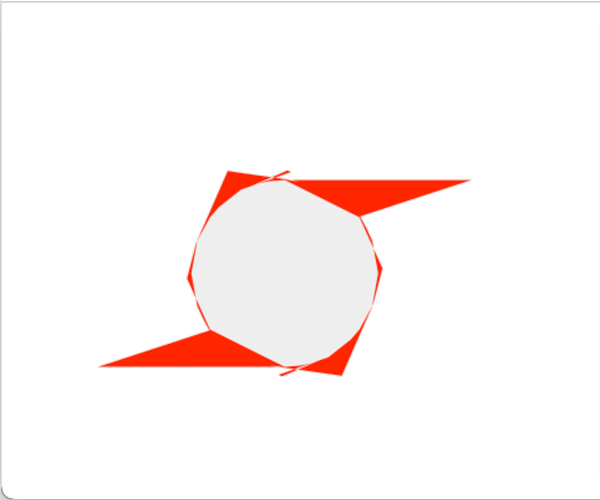
Rendering with the current code:
Not related. The red artwork “is” the bottom area from the city map.
This evening, I will try your suggestion.
Just in case someone is asking “what is all this burnout" ?
Here’s a link for the U.K. that explain a lot:
![]()


 .
.
