Chart Tutorial

Hi All.

I am so happy that xojo has incorporated charts “natively”.

However, I need a tutorial on how to use it PROPERLY. Note the word properly.

Going through the examples I don’t seem to see one there, but I might be looking in the wrong places. Is there a tutorial in examples. The one on youtube is a good starting point but am looking for something a little better.

And I have downloaded the examples but don’t seem to find it there.

Regards

Examples - Platforms - Desktop - Chart
image

I don’t know what you mean by ‘properly’.

Charts aren’t new on Xojo. they showed up for first time with Xojo 2020, but only for Web projects. we made it so DesktopChart/MobileChart have the same look/behaviour that was already knew from Web (and related documentation, including examples)

Anyway, you can find the example project for Desktop as has been pointed by Alberto, and maybe you can be interested in the blog post at: Graphic Charts for Xojo Desktop and Mobile – Xojo Programming Blog

if you need additional help, just ping me and I’ll be happy to help!

2 Likes

real (web chart) example of using data from database in a single method.
i think the preparation of data is the most difficult part.

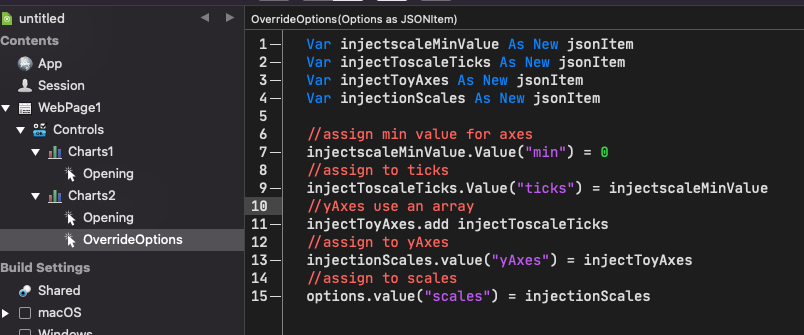
Public Sub Chart(start As DateTime, interval As DateInterval, minmax As Boolean)
  
  System.DebugLog CurrentMethodName
  
  Chart1.RemoveAllDatasets
  Chart1.RemoveAllLabels
  
  Chart2.RemoveAllDatasets
  Chart2.RemoveAllLabels
  
  '------------------------------------------
  
  Var db As New Module1.DB
  Call db.Connect
  
  Var d2 As DateTime = start 
  Var d1 As DateTime = d2 - interval 'zurück
  
  // Second set of data
  Var data1() As Double
  Var data2() As Double
  Var data3() As Double
  Var data4() As Double
  Var data5() As Double
  Var data6() As Double
  Var data7() As Double
  
  For d As Integer = 1 To Chart1.Width / 24.0
    
    Chart1.AddLabel d1.ToString(DateTime.FormatStyles.Medium,DateTime.FormatStyles.Short)
    Chart2.AddLabel d1.ToString(DateTime.FormatStyles.Medium,DateTime.FormatStyles.Short)
    
    Var s1 As Double = d1.SecondsFrom1970
    Var s2 As Double = d2.SecondsFrom1970
    
    Var rows As RowSet = db.SelectSQL("Select avg(VTIst) as VTIst, max(VTIst) as VTIstMax, min(VTIst) as VTIstMin, avg(VTSoll) as VTSoll, avg(AussenTemperatur) as AussenTemperatur, min(AussenTemperatur) as AussenTemperaturMin, max(AussenTemperatur) as AussenTemperaturMax From Zustand Where DateTime >=? and DateTime <= ?",s1,s2)
    
    While Not rows.AfterLastRow
      
      data1.Add(rows.Column("VTSoll").DoubleValue)
      data2.Add(rows.Column("VTIst").DoubleValue)
      data3.Add(rows.Column("AussenTemperatur").DoubleValue)
      data4.Add(rows.Column("AussenTemperaturMin").DoubleValue)
      data5.Add(rows.Column("AussenTemperaturMax").DoubleValue)
      data6.Add(rows.Column("VTIstMax").DoubleValue)
      data7.Add(rows.Column("VTIstMin").DoubleValue)
      
      rows.MoveToNextRow
    Wend
    
    d1 = d1 - interval
    d2 = d2 - interval
    
  Next
  
  '------------------------------------------
  
  Var myset1 As New WebChartLinearDataset("VT Soll °C", &cFF0000, False, data1)
  myset1.ChartType = WebChartLinearDataset.ChartTypes.Line
  Chart1.AddDataset(myset1)
  
  Var myset2 As New WebChartLinearDataset("VT Ist °C", &cFF0000, True, data2)
  myset2.ChartType = WebChartLinearDataset.ChartTypes.Line
  Chart1.AddDataset(myset2)
  
  If minmax = True Then
    
    Var myset6 As New WebChartLinearDataset("VT Ist Max °C", &c808080, False, data6)
    myset6.ChartType = WebChartLinearDataset.ChartTypes.Line
    Chart1.AddDataset(myset6)
    
    Var myset7 As New WebChartLinearDataset("VT Ist Min °C", &c808080, False, data7)
    myset7.ChartType = WebChartLinearDataset.ChartTypes.Line
    Chart1.AddDataset(myset7)
    
  End If
  
  Var myset3 As New WebChartLinearDataset("Aussen °C", &c404040, False, data3)
  myset3.ChartType = WebChartLinearDataset.ChartTypes.Line
  Chart2.AddDataset(myset3)
  
  If minmax = True Then
    
    Var myset4 As New WebChartLinearDataset("Aussen °C Min.", &c808080, False, data4)
    myset4.ChartType = WebChartLinearDataset.ChartTypes.Line
    Chart2.AddDataset(myset4)
    
    Var myset5 As New WebChartLinearDataset("Aussen °C Max.", &c808080, False, data5)
    myset5.ChartType = WebChartLinearDataset.ChartTypes.Line
    Chart2.AddDataset(myset5)
    
  End If
  
  '------------------------------------------
  
  db.Close
  
  '------------------------------------------
End Sub

interval box

SelectInterval.RemoveAllRows
SelectInterval.AddRow("5 Min.",New DateInterval(0, 0, 0, 0, 5))
SelectInterval.AddRow("15 Min.",New DateInterval(0, 0, 0, 0, 15))
SelectInterval.AddRow("30 Min.",New DateInterval(0, 0, 0, 0, 30))
SelectInterval.AddRow("1 Std.",New DateInterval(0, 0, 0, 1))
SelectInterval.AddRow("2 Std.",New DateInterval(0, 0, 0, 2))
SelectInterval.AddRow("4 Std.",New DateInterval(0, 0, 0, 4))
SelectInterval.AddRow("1 Tag",New DateInterval(0, 0, 0, 24))
SelectInterval.AddRow("7 Tage (Woche)",New DateInterval(0, 0, 0, 24.0 * 7.0))
SelectInterval.AddRow("4,3 x 7 Tage (Monat)",New DateInterval(0, 0, 0, 24.0 * 7.0 * 4.3))

SelectInterval.SelectedRowIndex = 5
1 Like

Echo this comment as a newbie to XOJO. Love the easy functionality - but not sure I fully understand it!
I can write code to track some numbers (actually golf scores) which tend between 80 and 100. The y axis will automatically draw from 0 to 100 which compresses the graph values at the the top of the chart.
Is it possible to modify the y axis values to (say) range from 80 to 100 please?

//Var labels() As String
Var firstSetOfData() As Double
Var m as integer

For n As Integer = 0 To mygross.Count - 1
firstSetOfData.add mygross(n).GrossAvg
Next

Me.Title = “gross scoring”
//Me.AddLabels labels

Var DS1 As New ChartLinearDataset(“”, Color.Blue, false, firstSetOfData)

DS1.ChartType = ChartLinearDataset.ChartTypes.line

Me.AddDatasets DS1

For Web the adjustment is automatic:
image

@Javier_Menendez should know what to do for Desktop or if a Feature Request is needed.

Edit: I remember that there is an option to set the Y axis start point (to override the automatic adjustment) but I haven’t used in some time.

Hi @Larry_Goddard

Nope, the Y axis always starts at 0.

Any plans to add an option to change the Y axis start point?
Do we need to create a Feature Request for this?
Imagine we want to create a chart like this:

imagine how it will look if Y axis always starts at 0.

I believe this issue covers what you are asking for.
https://tracker.xojo.com/xojoinc/xojo/-/issues/71720

Thank you Jeremie, I think so.

The other problem I see is that:
Xojo WebChart does not start at 0 when the data is all over 70 (see chart above from Xojo Web)
Xojo DesktopChart does start at 0 even when the data is all over 70

Both Xojo Charts should behave the same, right?

1 Like

Not exactly, because in that case “0” needs to be always displayed…

I think it is better/clearer if we have a new feature request for this one.

Yes, but… at the same time, we have received comments from other users expecting WebChart starting at “0”; being that considered as a “bug” :wink:

We can never be happy, you know that :slight_smile:

As far as I know:

  • there is no way to change DesktopChart to show Y axis starting at 70
  • there is an option for WebChart to make Y axis start at 0 (when needed)

I haven’t played much with Desktop Charts, so sorry if my information is not correct.

Nope, as far we know… there is no an option for that in WebChart

Yes there is, you need to implement the event OverrideOptions and create a JSONItem with the Y axis 0 value. I don’t have time to recreate this (I can’t find the example I did some time ago, it should be in one of the Issues, I will try to find it later).

Another option is to use the WebSDK version that Ricardo created and we are sharing here:
https://github.com/undtec/ChartJS

Instead of an event with OverrideOptions and JSONItem you use a dictionary and is easier (at least for me that I don’t work much with JSONItem) to override the Y Axis, like this:

both charts has the same data.

Yes, we know @AlbertoD but we are talking about the WebChart control itself (property) without needing to recur to WebSDK, overriding JS or similar… just the control.

Anyway… as I said, it is better to file a Feature Request for it on Desktop/Mobile :wink:

Here is the native Xojo WebChart in Xojo2023r1 the one at the top is automatic as ChartJS creates it (no 0 starting point). The second one is including the 0:

The only difference is this on the second chart:

Here I’m not using WebSDK or ExecuteJavascript to modify the Chart in any way, I’m using what Xojo is providing. Just had to review the documentation on the options for ChartJS to add the yAxes tick min = 0. We can use the OverrideOptions to add a label to the Y Axis and many things more.

If I didn’t understood your comment of “Nope, as far we know… there is no an option for that in WebChart” then I’m sorry.

Edit: the bar data in both is the same, the line data is random that’s why the line is different.

2 Likes

Yes, that means overriding the underlying Chart.js… so you need to know what from the js to override, as it happens also with other Web stuff… not a “simple” option in the WebChart control, I mean.

OverrideOptions(options As JSONItem)

Allows you to override the built-in features of WebChart by modifying the Options parameter passed.

WebChart is based upon ChartJS. See the ChartJS website for details on the format of the data in the Options parameter.

Ok, so it looks like we got lost in translation, I said:

there is an option for WebChart to make Y axis start at 0 (when needed)

and you said:

Nope, as far we know… there is no an option for that in WebChart

for me the OverrideOptions is an option, not an easy one I give you that but an option.

I guess you understood ‘option’ as a ‘simple way to set a property in WebChart’ and you are right, there is no easy way to tell the WebChart to include Y Axis 0 if it is not there, but for me: there is an option :slight_smile:

1 Like

Thank you for this. Pity that the desktop control implements in a different way to the web control but it is what it is!

Am I reading the other comments correctly that there is a feature request in place to modify this behaviour?