@Daniel_Fritzsche , yes I did it but I never found any file named profile.txt
This file should be stored on the server in the application directory. But it will be written when you close the app. And it must be a normal closing, so I would suggest, that you close the app in the code after returning the response.
I have used @Mariano_Poli 's code to recreate this simple example with both Xojo Web and Express (formerly Aloe Express).
I don’t have any Windows Servers… but thanks to @Tim_Parnell 's Lifeboat I have uploaded them to a VM in Microsoft Azure (probably one of the smallest one can get; just 1 vCPU an 1GB RAM; running Ubuntu 22)
Connection is from Switzerland (where I live, from at home) to Switzerland (this Azure-VM is hosted in Switzerland, too). I don’t use PAW, so I’ve used Postman (on a Mac).
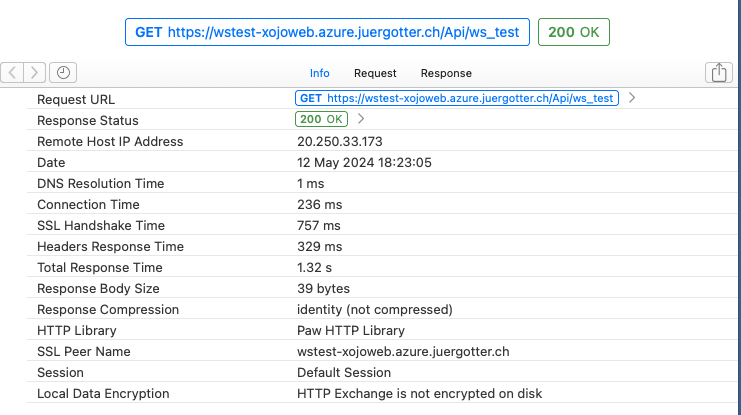
Connection to the WebService created with “Xojo Web”:
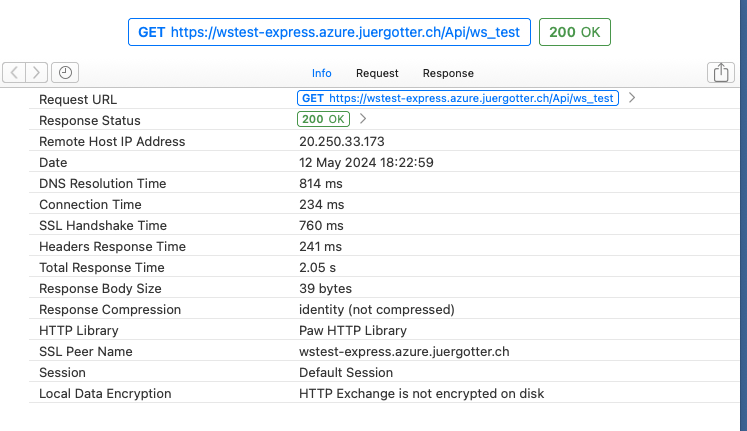
Connection to the WebService created with “(Aloe) Express”:
If you’d like to compare yourselves: I’ll leave the following two running for about 1.5h. After that the VM will be shut down, and I’ll remove these test-apps.
- https://wstest-xojoweb.azure.juergotter.ch/Api/ws_test
- https://wstest-express.azure.juergotter.ch/Api/ws_test
Sorry to show numbers with Xojo WebServices running on Linux… But I thought it’s interesting to maybe compare (Aloe)Express and XojoWeb. And one might well notice a difference between the Windows Servers your running and a very small Azure-VM running on Linux (in Switzerland).
1 Like
Thanks @Jürg_Otter
This were my time response from Argentina requesting your API:
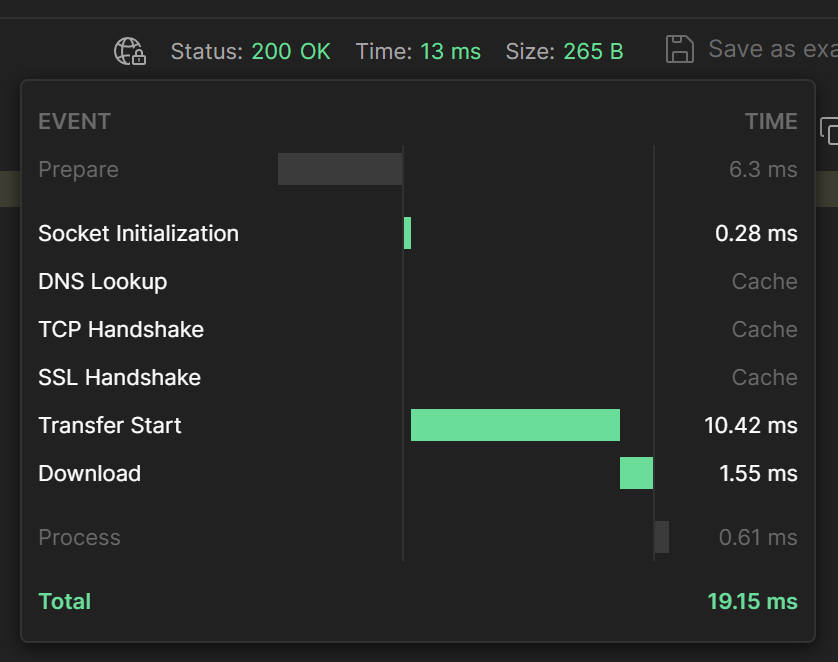
The most significant point I could see is that the Headers response time in your server, in both cases (Aloe and Xojo), comparing with mine, is half of the time. And for me this time is the most important one.
So I return to my original question:
What is needed to be done in order to reduce the headers response time ?
What app is that measuring the times?
I use PAW and in the info tab times are shown
1 Like
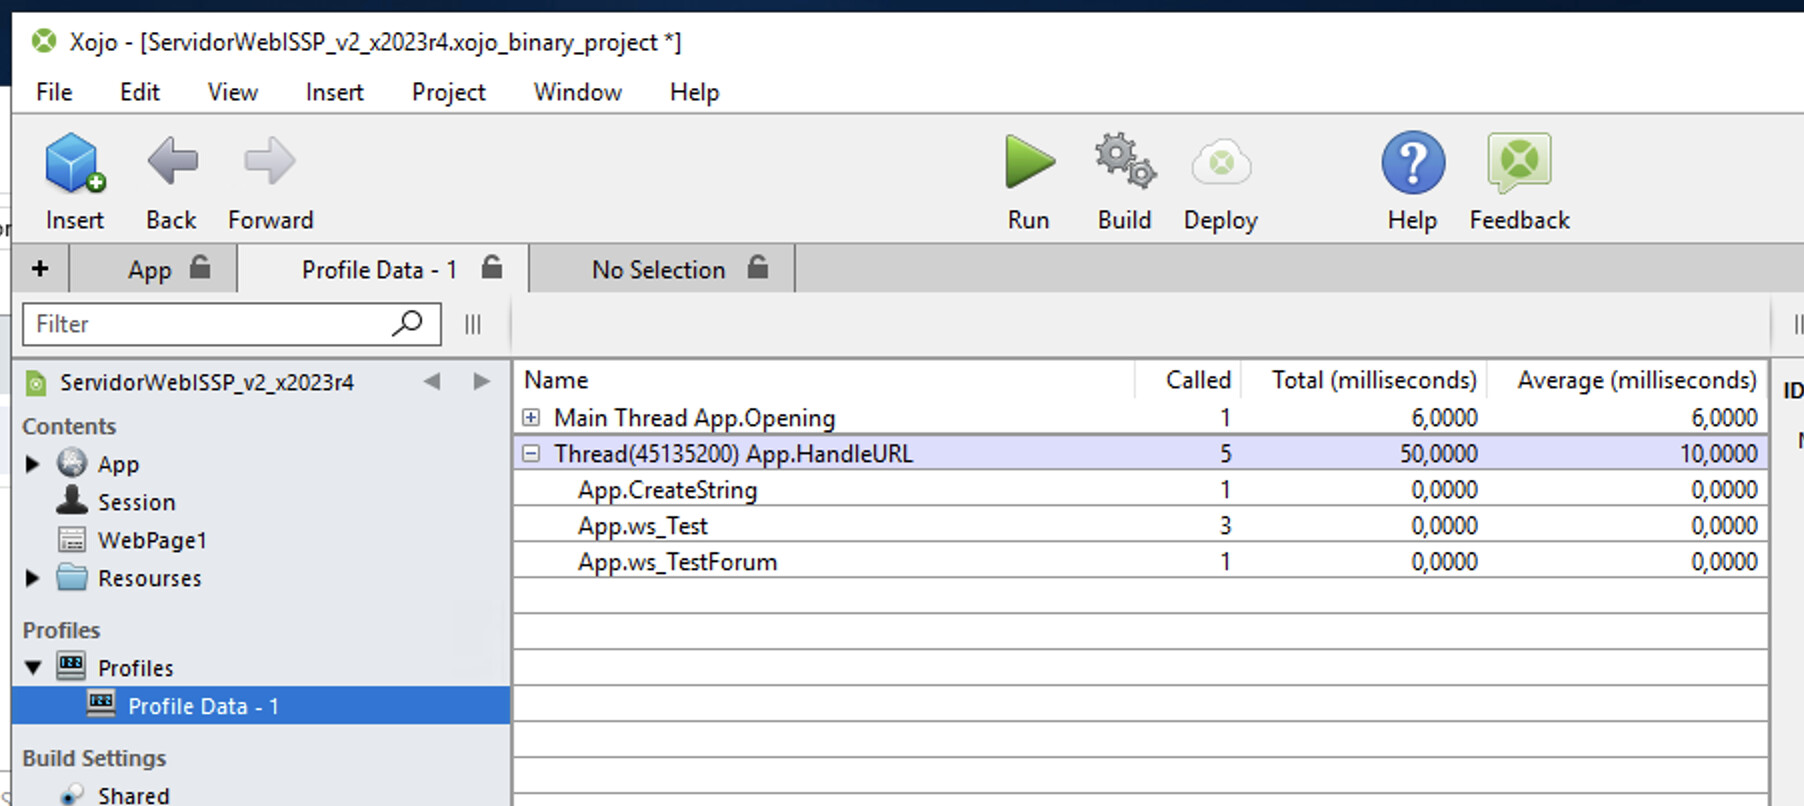
I had set the Profile Code and after 3 calls to the App.ws_Test and then to the App.ws_TestForum that quits clearly in order to generate the Profile data info.
It seams that it is not code. Do you agree ?
Could you please attach the express version project so that I can test it on a windows server?
1 Like
Thanks, I didn’t catch that on mobile.
Yes. It seams to be a framework thing…
So it is better to use the express way…
Sure. It’s basically just the example project, where I have placed the test code from this topic in App.Run and App.ApiRequestHandler:
I’m curious to know how such a simple request compares on a Windows Server (Express ↔ Xojo Web).
From the numbers above a very uneducated impression is that Express handles the request faster (one could save 50-100ms). But compared to all the overhead (e.g. connection from Argentinia to server in Switzerland) this doesn’t make much of a difference.
I’ll leave the above mentioned AzureVM running again today (it’s configured to shut down at midnight in Switzerland), just in case someone wants to test/try/compare. It’s certainly not the best VM to compare, as it’s only a single virtual core for the whole system… But somehow it would be cool to get an idea about the differences between Express<->XojoWeb as well as WindowsServer<->LinuxServer.
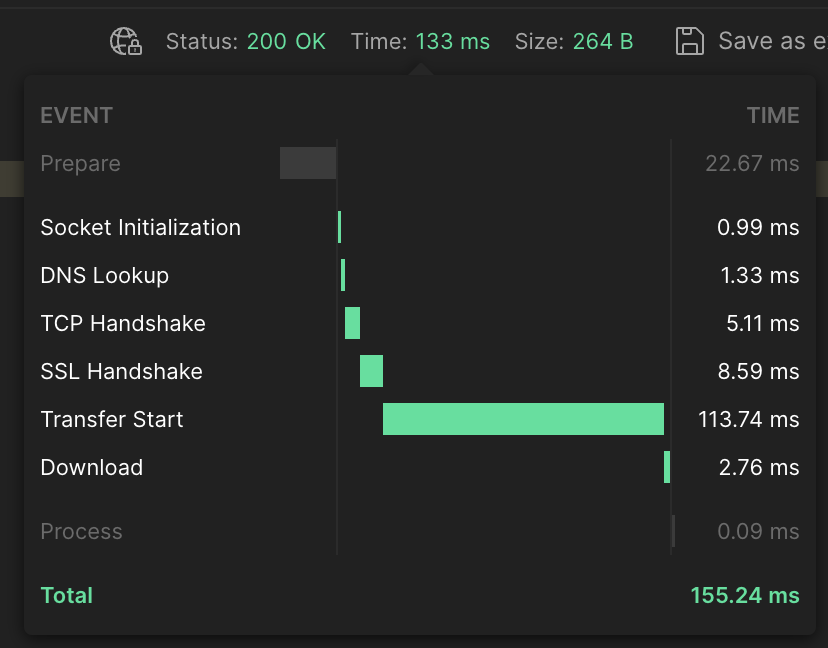
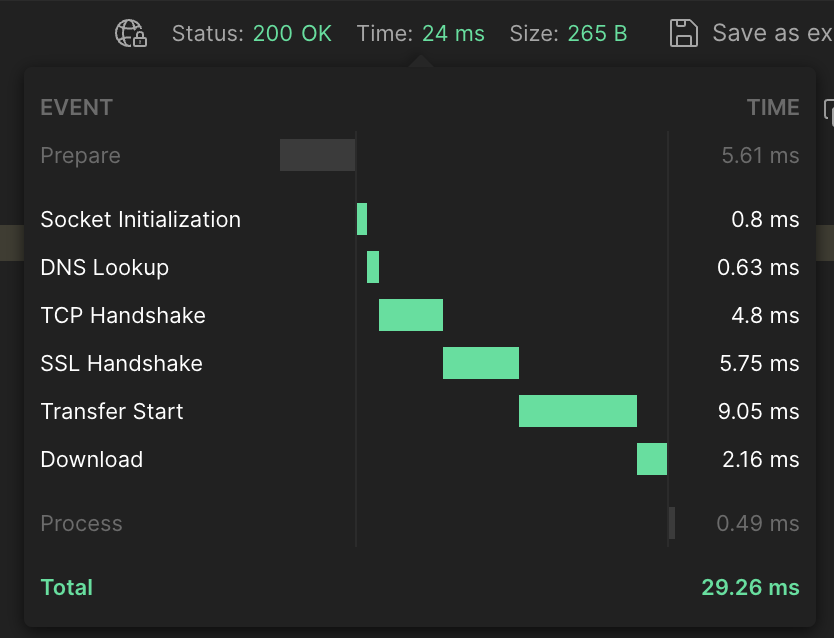
Edit: Somehow it also seems to make a difference with 2nd, 3rd request shortly one-after-another (as connection things get “cached”). That’s what I get for the connection to the Express Service in Azure (again: from/to Switzerland):
For doing these benchmarks for comparing frameworks, I think it’s much better to use a dedicated tool, like wrk:
It will send several requests, so you will be able to actually see the average response time, under load. Otherwise, if the server isn’t receiving requests frequently, the response time you’ll see will depend mostly on the value you have for DoEvents, and it will vary a lot between runs.
Here are the result of running wrk with 10 threads, 10 concurrent connections during 10 seconds.
2024r1.1 with Express (the example from @Jürg_Otter):
./wrk -t 10 -c 10 -d 10 --latency http://127.0.0.1:8080/Api/ws_test
Running 10s test @ http://127.0.0.1:8080/Api/ws_test
  10 threads and 10 connections
  Thread Stats   Avg      Stdev     Max   +/- Stdev
    Latency    27.12ms    2.91ms  46.97ms   86.38%
    Req/Sec    36.38      5.05    40.00     67.97%
  Latency Distribution
     50%   26.23ms
     75%   27.40ms
     90%   30.58ms
     99%   38.97ms
  3665 requests in 10.08s, 1.28MB read
  Socket errors: connect 0, read 1, write 0, timeout 0
Requests/sec:    363.70
Transfer/sec:    130.25KB
2024r1.1 with a Xojo Web project:
./wrk -t 10 -c 10 -d 10 --latency http://127.0.0.1:8080/Api/ws_test
Running 10s test @ http://127.0.0.1:8080/Api/ws_test
  10 threads and 10 connections
  Thread Stats   Avg      Stdev     Max   +/- Stdev
    Latency    10.31ms    8.88ms 150.80ms   98.77%
    Req/Sec   105.43     12.43   150.00     70.43%
  Latency Distribution
     50%   10.02ms
     75%   10.96ms
     90%   11.05ms
     99%   37.99ms
  10479 requests in 10.05s, 2.09MB read
Requests/sec:   1042.57
Transfer/sec:    212.79KB
2024r2 beta with the same Xojo Web project:
./wrk -t 10 -c 10 -d 10 --latency http://127.0.0.1:8080/Api/ws_test
Running 10s test @ http://127.0.0.1:8080/Api/ws_test
  10 threads and 10 connections
  Thread Stats   Avg      Stdev     Max   +/- Stdev
    Latency     1.95ms    6.17ms 111.46ms   99.03%
    Req/Sec   711.91     49.23   770.00     97.68%
  Latency Distribution
     50%    1.39ms
     75%    1.42ms
     90%    1.49ms
     99%    4.94ms
  70542 requests in 10.10s, 14.06MB read
Requests/sec:   6981.38
Transfer/sec:      1.39MB
Mileage will vary depending on the server specs, if you’re running the server locally or over the wire and other things, like running the benchmark on battery (like I’m doing now) vs. plugged.
5 Likes
The same test, using a Xojo Web project with the code posted by @Mariano_Poli, but this time comparing Windows vs Linux (both running as a VM on my Mac laptop).
App compiled for Windows 11 ARM 64 bits:
./wrk -t 10 -c 10 -d 10 --latency http://10.211.55.6:8080/Api/ws_test
Running 10s test @ http://10.211.55.6:8080/Api/ws_test
  10 threads and 10 connections
  Thread Stats   Avg      Stdev     Max   +/- Stdev
    Latency    39.16ms   16.53ms 242.85ms   93.05%
    Req/Sec    26.22      6.57    40.00     78.62%
  Latency Distribution
     50%   32.16ms
     75%   46.57ms
     90%   47.63ms
     99%  118.96ms
  2626 requests in 10.08s, 535.97KB read
Requests/sec:    260.43
Transfer/sec:     53.16KB
App running on Linux ARM 64 bits:
./wrk -t 10 -c 10 -d 10 --latency http://192.168.64.8:8080/Api/ws_test
Running 10s test @ http://192.168.64.8:8080/Api/ws_test
  10 threads and 10 connections
  Thread Stats   Avg      Stdev     Max   +/- Stdev
    Latency    28.82ms   13.02ms 157.96ms   77.63%
    Req/Sec    35.36     20.71   121.00     93.94%
  Latency Distribution
     50%   33.21ms
     75%   33.48ms
     90%   33.85ms
     99%   52.03ms
  3545 requests in 10.08s, 723.54KB read
Requests/sec:    351.57
Transfer/sec:     71.76KB
2 Likes
That’s awesome… ![]()
2 Likes
Simply awesome. … ![]()
1 Like
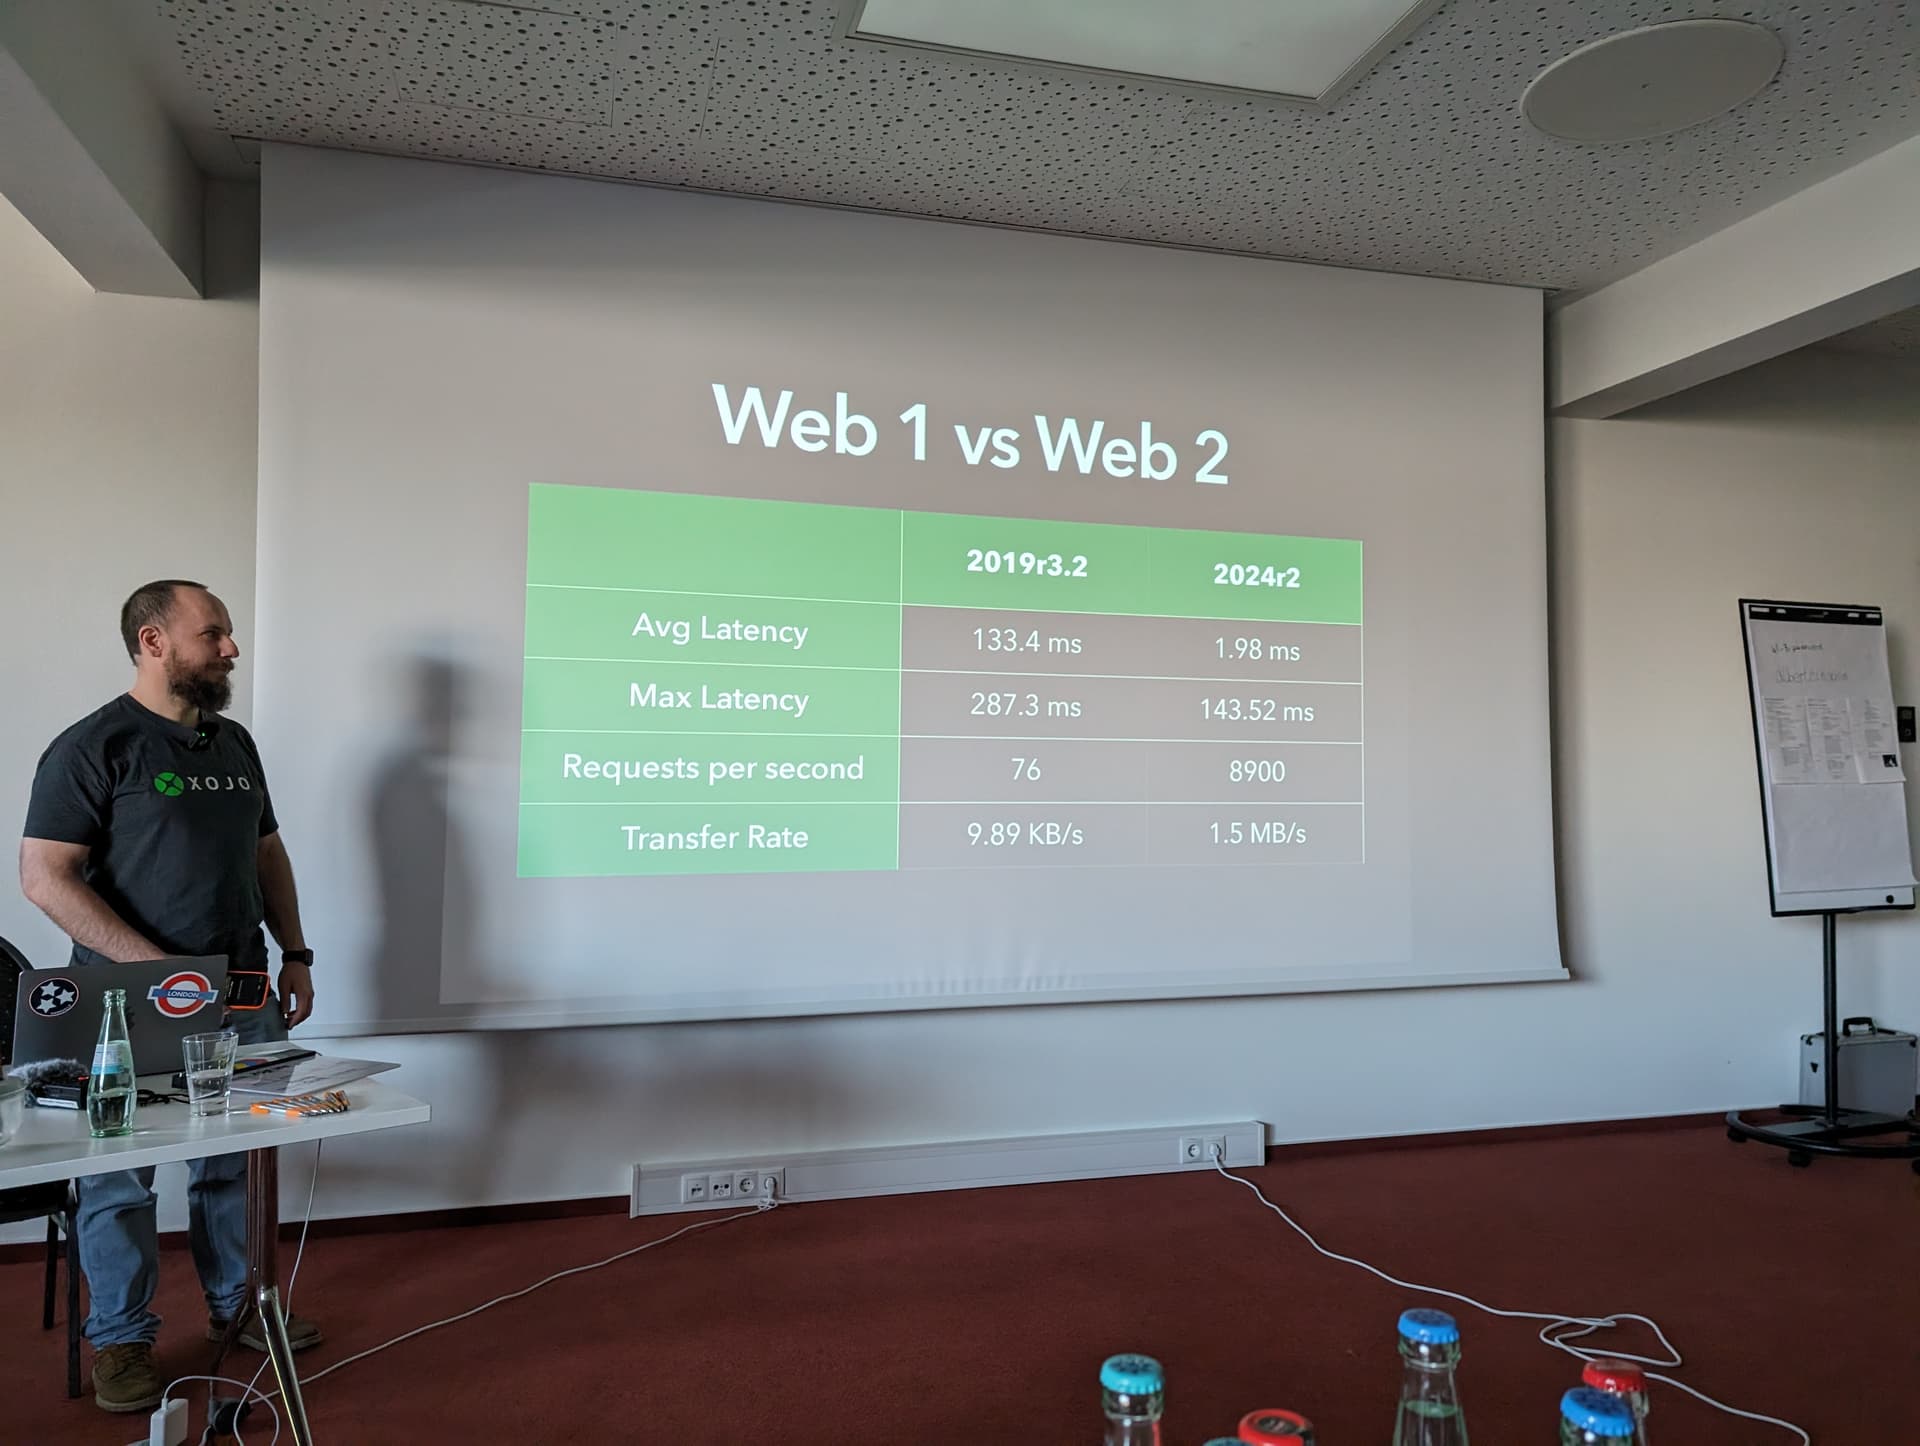
4 Likes
These improvements will also be reflected into faster response time for xojo web app web pages as well right?
The whole system should perform faster, yes. Not only the load time of a WebPage should be faster, the server should also be able to handle more control events, and respond to them with less latency.
4 Likes
Exciting stuff @Ricardo_Cruz When? ![]() We can’t wait to test!
We can’t wait to test!
1 Like