Is it a normal response time for middleware developed under Xojo 2023r4, running in a windows server 2019, to have an API response time (a very simple one, nothing complex) in a local network, of 600 ms.
With same devices, same local network but in a Linux server a Moodle API response time is about 120 ms.
you could add a timestamp in the request and repeat it at response and add a new timestamp.
more than a half second is very much.
a request usually return a website wich is then maybe load other resource like javascript from server via new requests, and in the end you will see the website completely.
firefox browser have nice developer tools build-in.
I would say: it depends…
How did you created your middleware ? xojo web or console app? Are you using aloe express?
What is the term “a very simple one” in your opinion? With or without database access? If with, which database system? Calculations? Just returning a constant?
Your question is to unspecific to give a reasonable answer… Do you have an example that we can test?
Thanks @Daniel_Fritzsche for your answer.
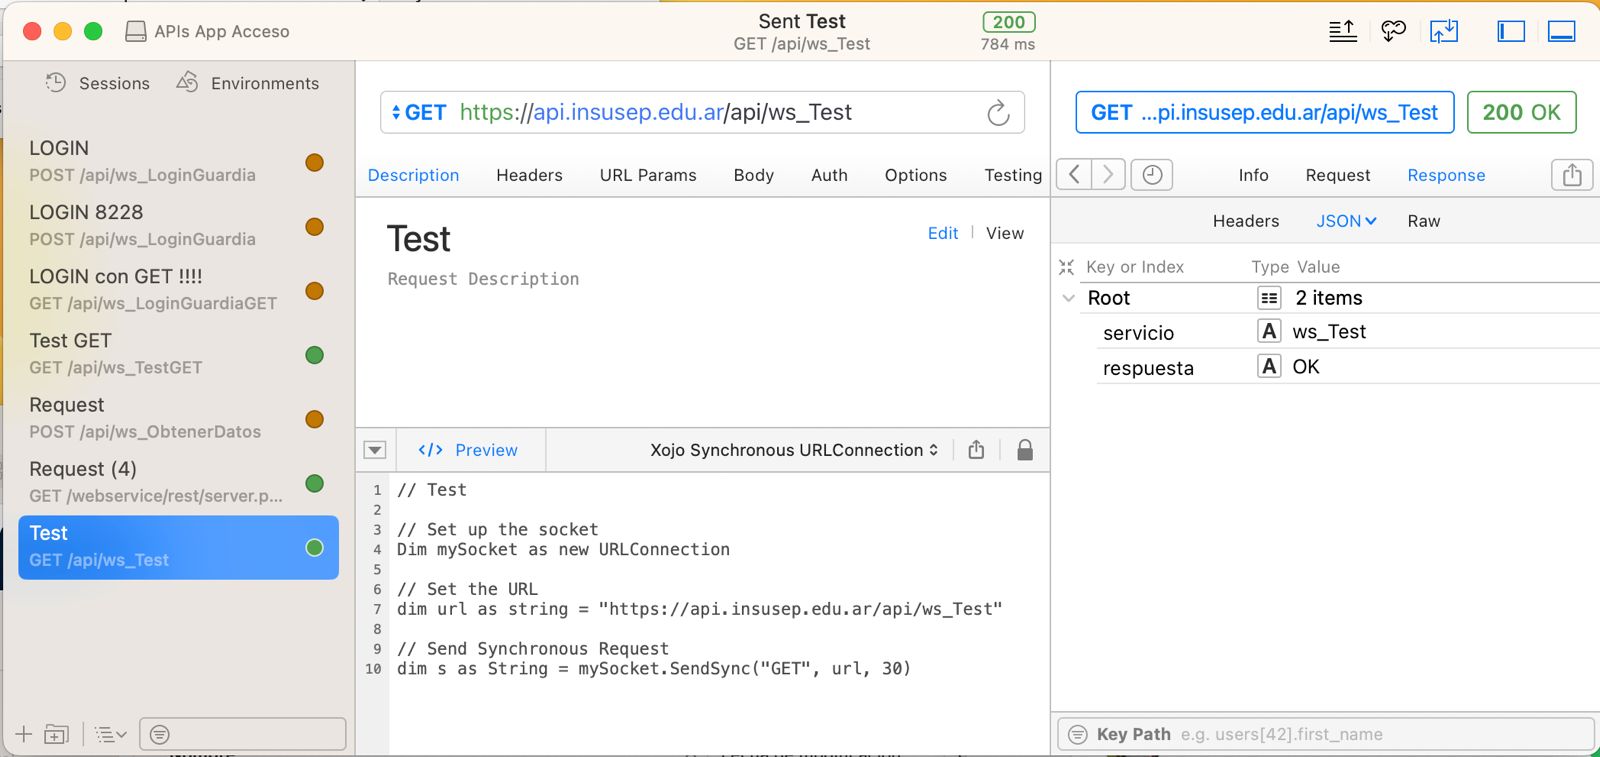
As I supposed that the database could add millisenconds as part of the time (I use Firebird) I decide not to include the database query into this particular webservice in order to test reaponse time “as pure as possible”. So the only one process that it is done in the middleware is to analyze the URLPath in order to see which webservice is invoked and returns a JSON that only includes an OK. So, as I said is an extreamly simple API web service.
It is a webApp and I am not using Aloe
Ok, so can you post the project? I would then test in my environment, to see if I have same response times. This way we could exclude local influence of the environment. I am personally interested as we are planning something similar in the future.
Just profile your app. You may find that the query you are doing is what takes the majority of the 600ms and that the app itself responds very quickly.
1 Like
Just to add supplemental data, I test availability of my web apps using the (undocumented) Xojo ping endpoint and it’s quite quick.
From my location (East Coast) with a GET request to Web 2.0 hosted on Linux:
- Averaging 85ms for East Coast servers
- Averaging 140ms for West Coast servers
- Averaging 165ms for the London, UK server
My Web 1.0 apps using the same endpoint are a little slower, ranging from 150-200ms. All of these are on the East Coast.
And lastly to illustrate the difference in optimization, nginx responds with my main website in 30ms.
All of my configuration is done with Lifeboat.
2 Likes
So this could lead us to a problem running webapps on windows server?
How does this work?
It’s undocumented, so there’s no official explanation. You could ask for an official explanation from staff. I found it digging through my nginx logs. It just responds with a status of 200 and a body of “pong”.
The WebService App contains:
In App – Event Handlers – HandleURL
var salida as JSONItem
select case request.Path
case "Api/ws_test"
  salida = ws_test
  response.Status = 200
  response.Header ("Content-Type") ="application/json"
  response.Write( salida.ToString )
end select
return true
and the method ws_test
ws_test as JSONItem
Var jsonOutput as new JSONItem
jsonOutput.value("servicio") = "ws_Test"
jsonOutput.value("respuesta") = "OK"
Return jsonOutput
and as you see using PAW the response time is near 800mseg
some additional data:
I am using Xojo 2023r4
Web App Architecture is x86 32bits
And server is as follows:
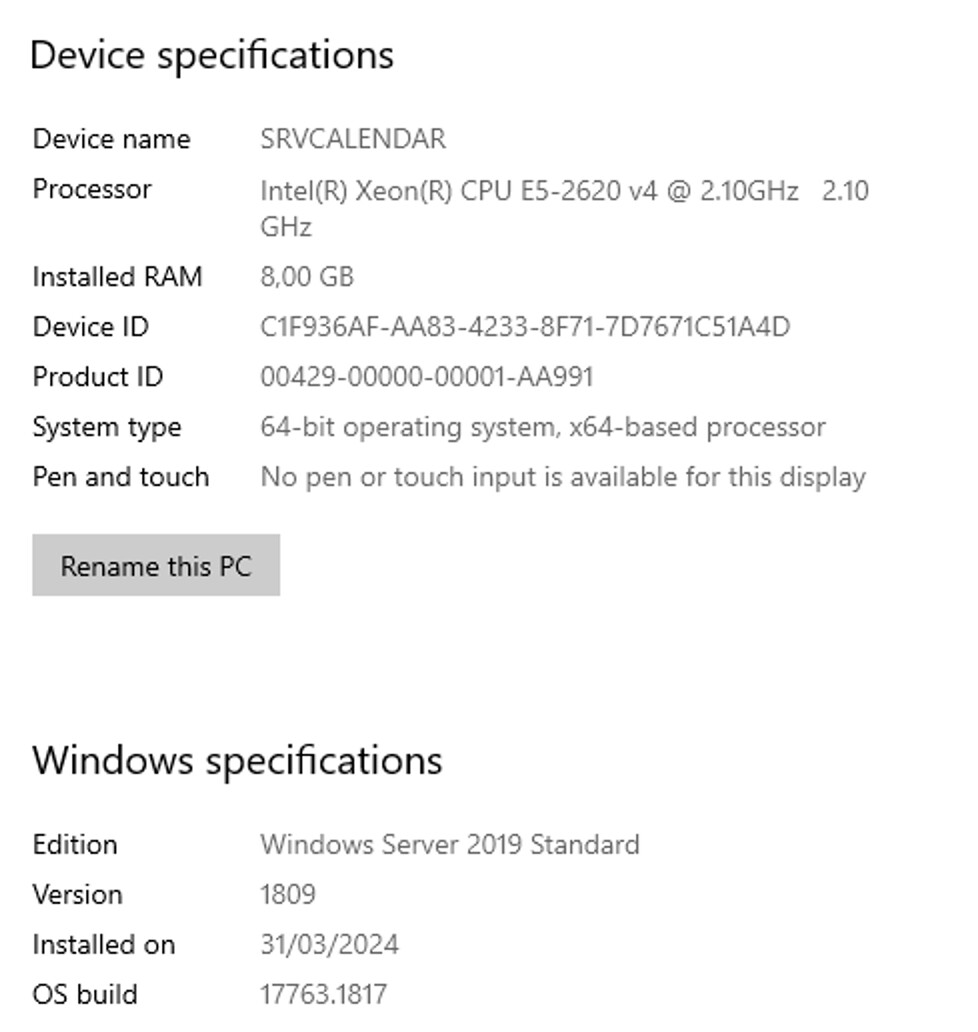
You could tested from outside (I am testing from Argentina and the server is also in Argentina)
It is a GET request to:
https://api.insusep.edu.ar/api/ws_test
I did a test against the xojo/ping endpoint on my server which is NOT on my local network. So here it is:
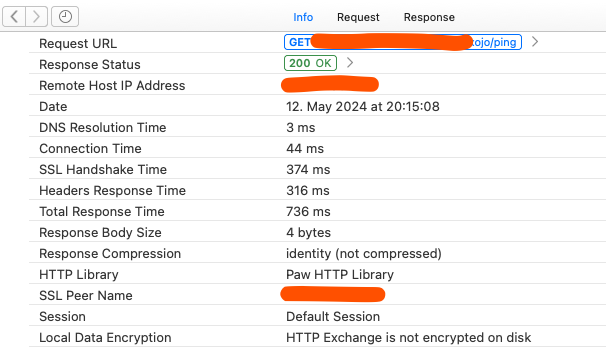
When you go to the info tab in paw, you see the response time split up in DNS resolution, Connection, SSL Handshake and Headers Response Time…
Half of the time is needed to get the ssl handshake done. The rest is for the response.
My App was compiled with an older Version of xojo 2023 R1. so that might be different with 2023R4.
My Server is a virtual windows server which is hosted by a german provider. So there might be influence of the host and the number of virtual machines running on the host.
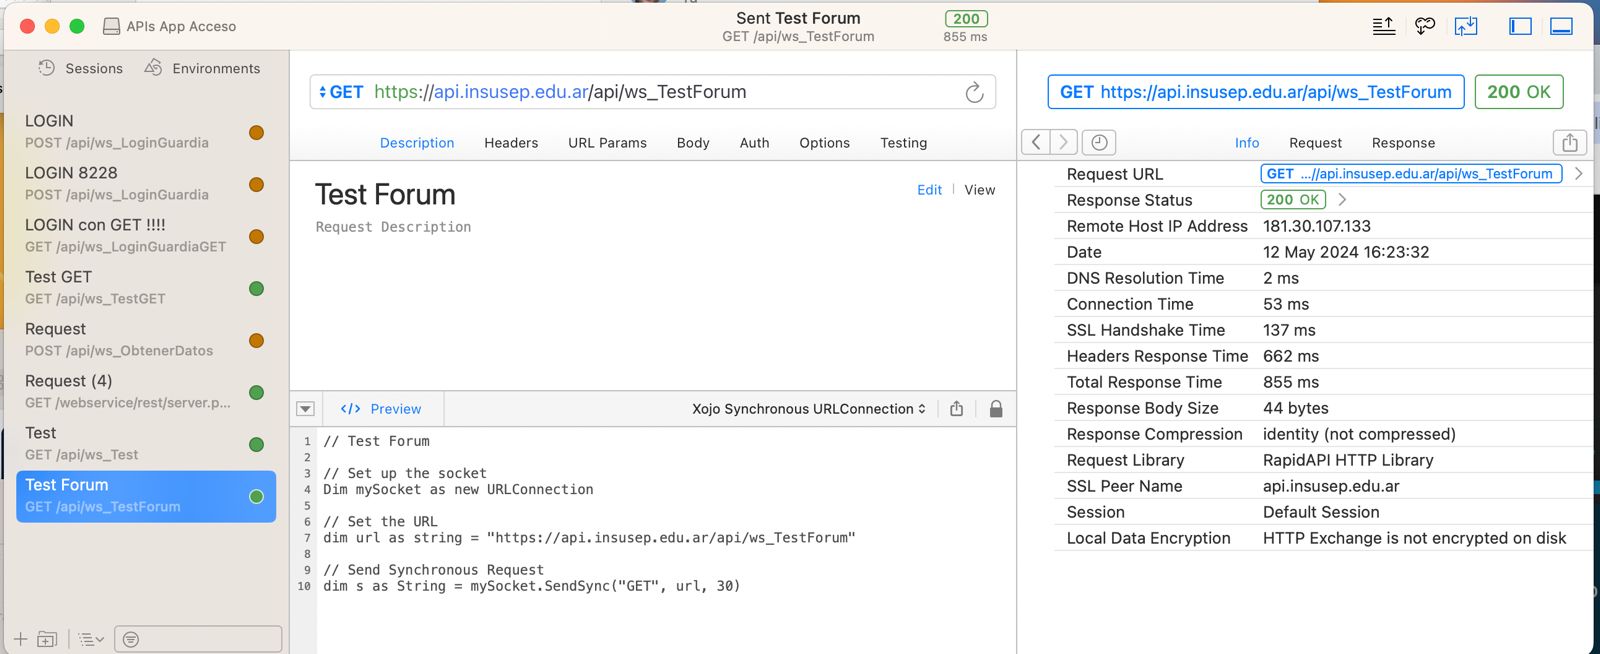
The stats for calling your url from germany look like this:
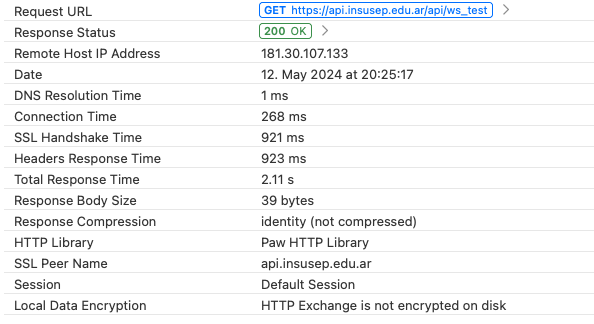
All these times may vary because of the distance from germany to argentina… and will differ from each location and provider.
Thank both @Daniel_Fritzsche & @Tim_Parnell
This are the numbers I have:
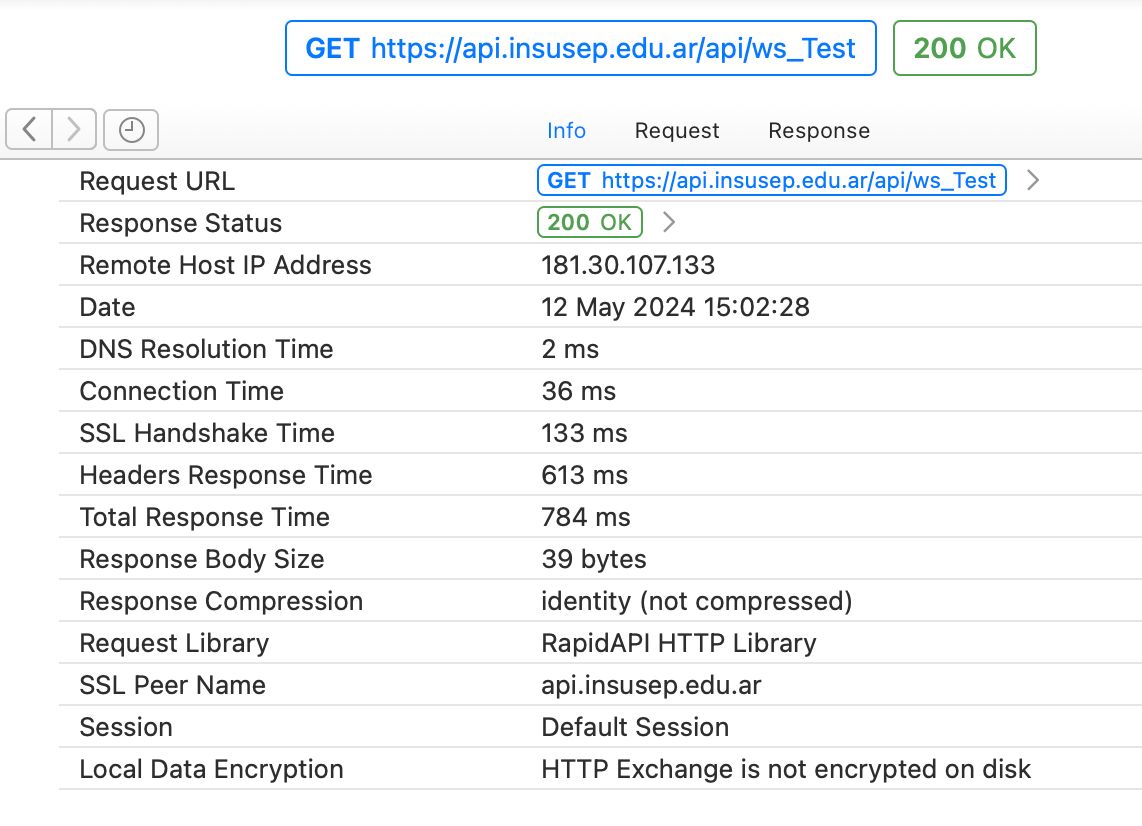
and as you said header response time takes the most of the total time.
What is needed to be done in order to reduce it ?
As an addendum to my posted times earlier (I can no longer edit the post), the numbers were coming from the app I use for uptime tracking, Ping.
Comparing the number to the Paw/RapidAPI detailed results, it appears to be giving me different values and I haven’t determined a pattern as to what Ping may be computing to give me the numbers it is.
The 85ms example from Ping is turning up as 270ms Total Response Time in RapidAPI…
The 140ms example from Ping is 590ms Total Response Time in RapidAPI…
For fairness, the main website 30ms example is reporting 140ms in RapidAPI.
So we are coming back to Gregs proposal to profile your app. Could it be, that the generation of the jsonitem needs so much time? Or the JSONitem.tostring needs much time. To get this sorted out, I would create also a method for the generation of the string, so that it can be seen in the profile later.
Sub CreateString(pJSON As JSONitem) As String
  Return pJSON.ToString
End Sub
This way the profiler could give a time for this step only.
your code would be then:
var salida as JSONItem
select case request.Path
case "Api/ws_test"
  salida = ws_test
  response.Status = 200
  response.Header ("Content-Type") ="application/json"
  response.Write( CreateString( salida ) )
end select
return true
1 Like
@Daniel_Fritzsche if I am not wrong, you are also having a Total Response Time in the order of 700/800 mseg… similar to mine…
It is supposed that Xojo 2023r4 increases may times performance of web apps… but the tests are not showing that… mostly the same between 2023r1 and 2023r4
so:
- May be XOJO the problem ?
- May be XOJO running under Windows Server ?
- May be the architecture (32 bits) ?
I will try your code and I will send back the new times with it
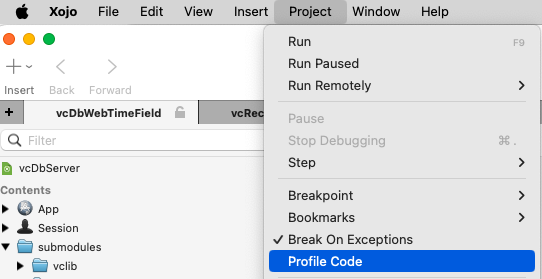
You should enable code profiling in xojo:
Personally, I would definitely drop Windows Server and use Linux 64bit. A bit of searching around and it seems many hosts agree that Linux is faster. I even stumbled across a link to an article from a Windows kernel developer explaining why it is slower.
My results could be tainted though, as I’m always searching Linux server tips and information. Search engines trying to be answer machines and all that…
You may want to do some research about which systems are faster for yourself. I wholly recommend Debian Linux. I rely on it and even wrote an app that will help you configure your Linux server specifically for Xojo Web.
I had compiled the WebApp for 64 bits and same times of response
Have you activated the profiling? When compiling with the option, there is a warning, that code profiling ist active. When running the app there will be a profile log file in the folder, which can then be analysed. There is a tool Profile Reader which can then read the files: