As a followup, @Ricardo_Cruz has some really great data using wrk.
Just for kicks I just ran wrk versus oha to see the comparison. One important thing to note is that oha is in active development and is “newer” with more UI than wrk.
./wrk -d 60s -c 100 --latency https://myServer.com
./oha -z 60s -c 100 --latency-correction --disable-keepalive https://myServer.com
There are some deltas since my initial posting in February…
DigitalOcean (DO) Droplet
Debian 12 x86
Premium AMD w/ NVMe SSD
2 GB / 1 AMD CPU
50 GB NVMe SSDs
Now at a higher premium tier ($14 as of this writing).
Web apps loaded via Lifeboat with an nginx backend and no load balancing
Xojo
Web 2.0 app compiled under 2024r1
Mirroring my prior test runs, here is what wrk versus oha looks like…
wrk
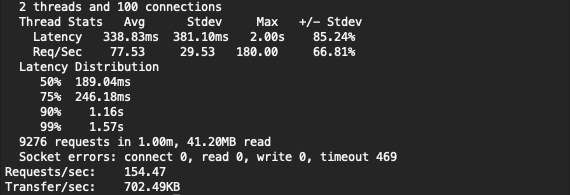
oha

What’s particularly interesting here is how different the results are from each tool. For example wrk shows 154.47 requests per second versus oha at 20.0599. wrk also shows 469 timeouts versus 8 under oha. wrk shows 9276 requests versus 1120 responses under oha (which matches up to 20.0599 requests/sec * 60 seconds). The latency and response times are all over the place in comparison to the two tools. Some of this might come down to what’s being loaded up as wrk shows 41.20MB read versus oha at 1.60MiB so maybe wrk is loading up the whole web app but oha isn’t. But this also doesn’t make sense as wrk is showing better response and throughput than oha.
For comparison with Ricardo’s own data in the other thread, here’s two more runs, but this time with the duration and connections reduced to 10…
./wrk -d 10s -c 10 --latency https://myServer.com
./oha -z 10s -c 10 --latency-correction --disable-keepalive https://myServer.com
wrk
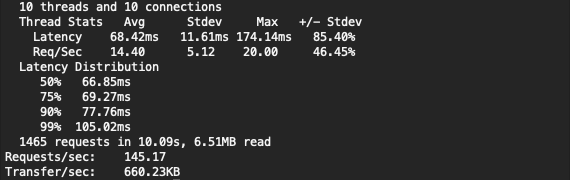
oha

The same analysis as above, appears to hold true here as well. I think the big take away isn’t to try and rectify the deltas between these two tools, but instead that one should pick a single tool and then stick with it to capture the positive or negative deltas over time as the analysis methodology will be consistent then.
This does continue to beg the question of, “What exactly is the throughput of Web 2.0 and how many users can a server sustain in burst as well as normal operations?” Of course, lots of variables feed into these questions and all these load tester tools are theoretical in nature so there might never be a fully accurate number here.