Is there a way to add a line of text to the Xojo stack trace at any desired moment from code?
Please note that I’m not asking about using the System.DebugLog or other alternatives; I’m asking specifically about the stack trace.
Thanks.
Is there a way to add a line of text to the Xojo stack trace at any desired moment from code?
Please note that I’m not asking about using the System.DebugLog or other alternatives; I’m asking specifically about the stack trace.
Thanks.
Strange, I’ve never had a question on this forum sit unanswered for so long…
If this question can’t be answered, maybe a related question can be? That would be: how does an item end up as a line on the stack trace? It appears that it lists calls to methods, but do subs within subs get listed? What about threads? Seems very complicated. Regardless, being able to inject a line of text into the trace could be useful for debugging.
It’s a trace of the call stack, which is a last-in-first-out list used internally to keep track of the “subs within subs” relationship between methods.
The topmost/most-recent method in the stack is the currently executing method. If the topmost method (“SubA”) invokes another method (“SubB”), then SubB is pushed onto the top of the call stack and becomes the currently executing method. When SubB finishes execution it is popped off the top of the stack and execution returns to SubA. When SubA finishes it gets popped and execution returns to its caller in exactly the same way. When there are no more entries in the stack the application or thread exits. A thread has an independent call stack, which is also a fairly accurate description of a thread itself.
The stack trace provided by the RuntimeException class is a snapshot of the call stack at the moment the exception was raised. A line is added to the top when a method begins and is removed from the top when the method returns.
Why would you call this strange?
No.
Hi Andrew. Thanks for the reply. What you explain is what I understand a stack trace should be. But it doesn’t seem to be what the Xojo stack trace is. At least it’s not what I see when I turn the stack trace into a list of text with:
dim t as string
    for each element as string in error.stack  //  only works if the Include Function
      // Names option is enabled in the 'blessed' App class's properties.
      t = t + element + EndOfLine  //print one line for every stack entry
      // (includes method where error occured)
    next
The output of t does not include every method called. It also doesn’t include every thread. It seems to be only the main thread, and also only some kind of a filtered list of the actual stack.
[quote=280128:@Eli Ott]@Aaron Hunt Is there a way to add a line of text to the Xojo stack trace at any desired moment from code?
No.[/quote]
In principle, calling a method should add a line to the stack trace, but in Xojo, it doesn’t seem to work that way. Why?
It is a stack trace, not a method call trace.
It is the stack trace of the thread where the error happened.
No.
[quote=280134:@Eli Ott]@Aaron Hunt The output of t does not include every method called.
It is a stack trace, not a method call trace.[/quote]
Okay, so if I have:
SubA
1 - executes some code
All I will see on the stack trace is SubA, because the other subs have popped off the stack. So in the above example it would be impossible to know if the error happened at point 1, 2, or 3 – impossible to know from the trace whether the other subs were called or not?
Yes.
But the stack trace would start where the error happened. So if it happened in SubB it would start with SubB, etc.
Yes, it is not possible to know that from the stack trace.
[quote=280140:@Eli Ott]@Aaron Hunt – impossible to know from the trace whether the other subs were called or not?
Yes, it is not possible to know that from the stack trace.[/quote]
Okay. Thanks for the clarification. This is why I would like to inject a line into the stack trace, to know where in the method the error occurred, not just that it occurred in this method. But I see why it’s not possible. Too bad. There are sometimes bugs from customers I can’t reproduce. A method call list would help. I know I can make my own. I was just wondering if it could be easier than that.
But you have the error raised, so as along as it is not a “silent crash” meaning the app crashes and disappears without producing a stack trace and an exception, which you can print, mail or display , you know where the error happened. And most importantly, what kind of error happened (NilObjectException, etc. etc.).
Well, again, that’s often not enough to debug. You know only within which method the error happened. That’s not exactly “where”. Within that method there can often be things going on like I describe above, where it is impossible to know from the trace exactly where the error is, meaning exactly where in the code, before or after certain calls, etc. For errors that aren’t reproducible by me (that are only reproducible by the customer) that means I can’t debug it without adding some other mechanism to give me more information about what’s happening. An additional method of logging is necessary for those situations.
As I mentioned, the type of exception will give you a hint, where the error could have happened. For example a encoding issues in an file import routine will likely not be a NilObjectException, but the FolderItem object might be, etc.
Sure, but it’s often not enough. Been using stack trace bug reports in my software for years. Looking for a solution for the harder situations. Stack trace alone not cutting it.
It is amazing how often a question has already been asked. I know this thread is old, but I was just searching for exactly the same question.
I am trying to bust a nasty little bug that occurs only in a few buyers exe, but never on my machine.
When a method is a bit complex, it is difficult to find exactly where the issue arised.
Like Aaron, I have looked at every single line of my code in the hope to spot the critter to no avail.
I am considering replacing system.debuglog by my own log() method, so I put all debugging messages on my own messages stack, and send this back home together with the stack. Hopefully, this will provide just enough extra information to see where the error exactly occurs.
Maybe a feature request would be at hand for:
Addin the CurrentMethodName to a RuntimeException so you can always get the last method that had an exception. Ofcourse this would only be useful to UnhandledException errors and not hard crashes but it would be much easier to find a solution to an exception that is not handled.
I’ve had questions that never got answered.
I always pass the CurrentMethodName to a custom ReportError method to handle unexpected exceptions. And if I need to troubleshoot user reports at a finer resolution, I’ll sprinkle a “errPart” integer through out key points of a method (in place of a built-in “line number” variable) and pass that as well, to help hone in on the issue…
For example:
Sub SomeBuggyCode()
    var errPart as integer

    errPart = 1
    for each f as folderitem in myFiles
        errPart = 2
        if f.exists then doSomething()  // bug! f could be nil
    next
    errPart = 3

    Exception err
       ReportError(CurrentMethodName+" Part "+str(errPart), err)

End Sub

Module UtilityFunctions
    Sub ReportError(errMsg as string, err as runtimeException = nil)
         // Dialog to report issue to developer via email or whatever.
    End Sub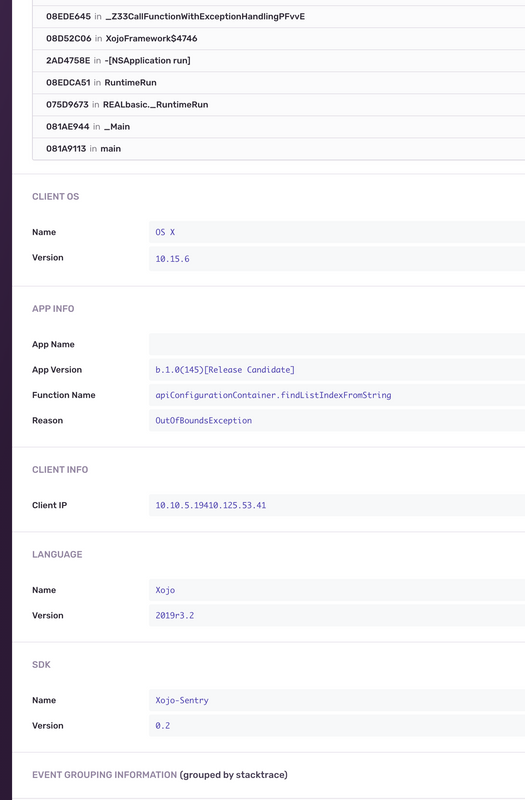
End ModuleFunction Name, Reason, the stack trace and some additional platform info is what I send to Sentry.io for exceptions. It completely allows me to zone into my issues within minutes most times.
Here is a screen shot portion of what my Sentry.IO implementation yields me for any app of mine in production. (I obfuscated the app name in the image)
We use airtable for such, can do much more with airtable… but anything that works is good enough for reporting…