Webcharts Localization not possible?

OK, I used @Jeannot_Muller OverrideOptions code as a starting point:

var injectionTitleChild as new jsonItem
var injectionTitle as new jsonItem

injectionTitleChild.value("display") = true
injectionTitleChild.value("text") = "myExample"
injectionTitleChild.value("fontSize") = 20
injectionTitleChild.value("fontColor") = "#0096ff"
options.value("title") = injectionTitleChild


var injectionValue as new jsonItem
var injectionTicks as new jsonItem
var injectionyAxes as new jsonItem
var injectionScales as new jsonItem

injectionValue.value("stepSize") = 0.5
injectionValue.value("beginAtZero") = false
injectionTicks.value("ticks") = injectionValue
injectionyAxes.add injectionTicks
injectionScales.value("yAxes") = injectionyAxes


var interim as string = injectionScales.ToString

options.value("scales") = injectionScales

Then put the following in the Shown event of the chart:

var exec() as String
exec.Add( "var chartObj = XojoWeb.getNamedControl('" + me.ControlID + "').mChartObj;" )
exec.Add( "chartObj.options.scales.yAxes[0].ticks.callback = function(value, index, values) {" )
exec.Add( "  return value.toLocaleString('fr', {minimumFractionDigits: 2});" )
exec.Add( "};" )
exec.Add( "chartObj.update();" )
ExecuteJavaScript( String.FromArray( exec, "" ) )

You can obviously swap out the 'fr' on line 2 with Session.LanguageCode, or the minimumFractionDigits with a more appropriate value for your use.

exec.Add( "  return value.toLocaleString('fr', {minimumFractionDigits: 2});" )

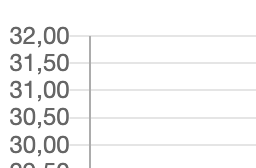
And here’s the resulting Y axis.
image

2 Likes

A bit more generic, add this method to a module:

Public Sub UpdateYAxis(extends chart as WebChart, locale as String, fractionDigits as Integer)
  var exec() as String
  exec.Add( "var chartObj = XojoWeb.getNamedControl('" + chart.ControlID + "').mChartObj;" )
  exec.Add( "chartObj.options.scales.yAxes[0].ticks.callback = function(value, index, values) {" )
  exec.Add( "  return value.toLocaleString('" + locale + "', {minimumFractionDigits: " + fractionDigits.ToString( "#" ) + "});" )
  exec.Add( "};" )
  exec.Add( "chartObj.update();" )
  chart.ExecuteJavaScript( String.FromArray( exec ) )
End Sub

In Shown event:

me.UpdateYAxis( "fr", 1 )
2 Likes

impressive @Anthony_G_Cyphers , as always !

so in the end you can make the callback work with a webchart, but with executejavascript method, not with the override options !

Correct. Any other callbacks would need to be similarly implemented.

Hi,
I find this topic, and it is very important for me.
I think your solution is very close to my possible solution but I can’t complete my code.

I try to adjust webchart to put over the bar the number values and I find this example javascript - How to display data values on Chart.js - Stack Overflow (Edit fiddle - JSFiddle - Code Playground)

I’m not a good developer for JS so I have some problem to take the code JS in the stackoverflow example and put it in the Xojo string for the executionjavascript.

Can some one help me?
Thank you,
Oscar