im using DB for showing with web chart.
this is data form : 2022-02-02 11:22:33, data1, data2…
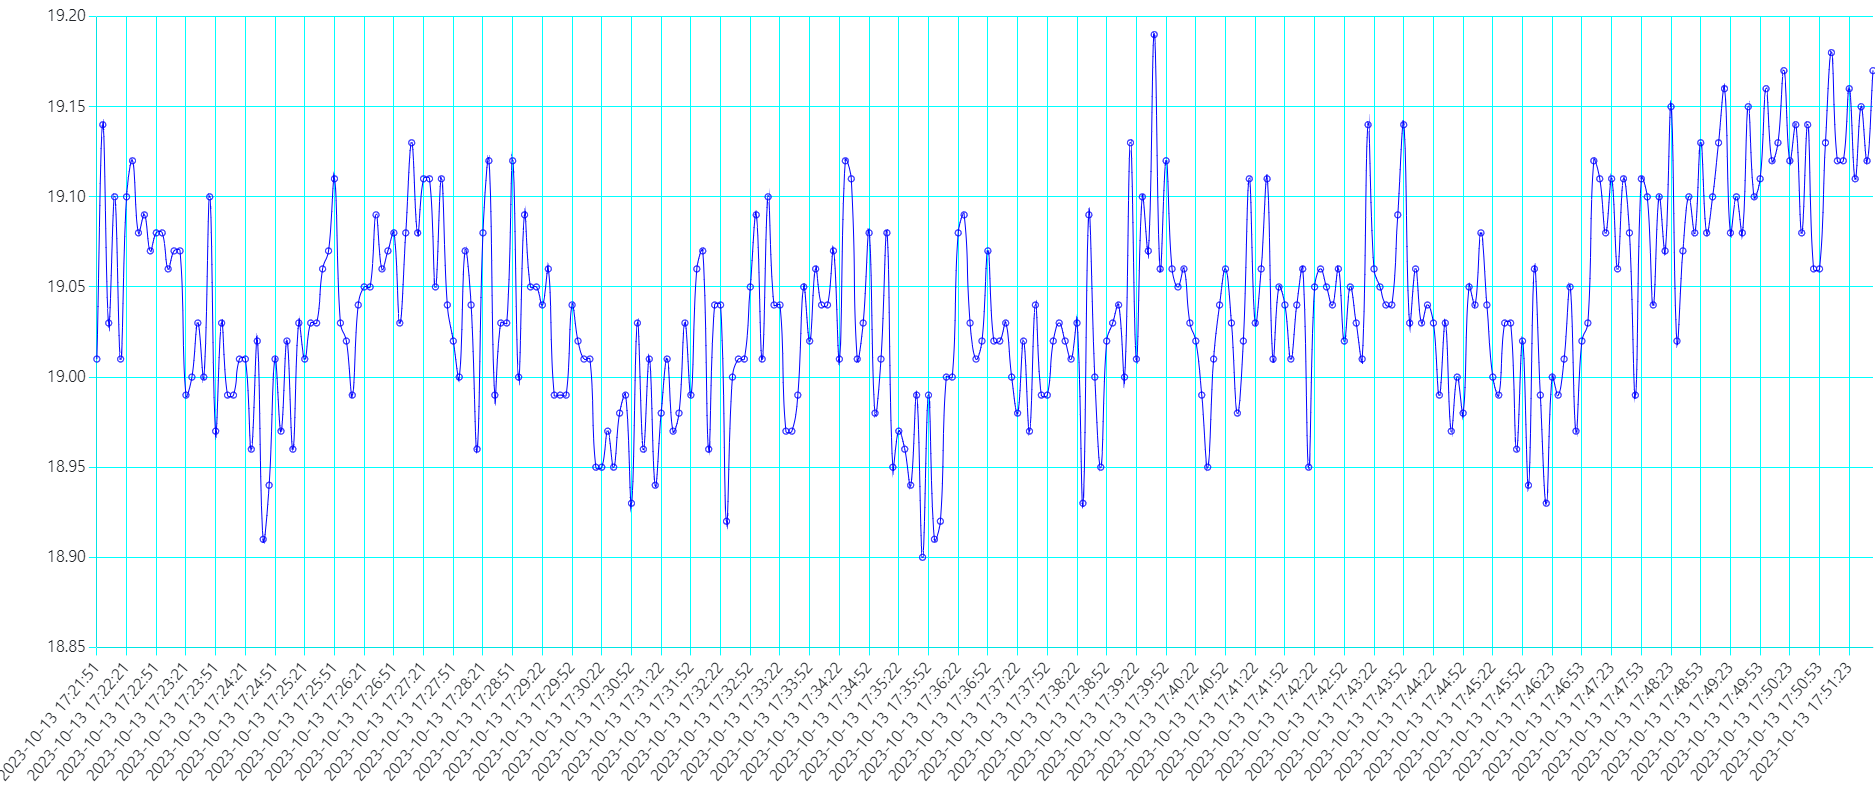
but my application is showing thousands data at once so the line of label under chart has gone too much long and big. as above
its become big problem too much when user using mobile
i found i can use “override option” and this is chart.js but
im pretty novice of this and even it was not working with just making “JSON” text…
so,
- how can i make the label under to showing only 4 (or specific number of)
- how can i make the label form to another? (eg. 2022-02-03 11:22:33 => 03 11:22:33) without fixing original label?
ps/ 2. bcz i need to keep form of label for cursor on data line.
+++
i create some code for it. but it doesnt work at all
var injectionValue as new jsonItem
var injectionTicks as new jsonItem
var injectionyxAxes as new jsonItem
var injectionScales as new jsonItem
’
injectionValue.value(“autoSkip”) = True
injectionValue.value(“maxTicksLimit”) = 4
injectionTicks.value(“ticks”) = injectionValue
injectionyxAxes.add injectionTicks
injectionScales.value(“x”) = injectionyxAxes
’
options.value(“scales”) = injectionScales
ok solved.
maybe it was my mistakes from btw “old info<->new released” chart.js usage.
(probably) in chart.js version before 2023 (eg.2022.r1) of xojo,
“xAxes” was “having” ticks.
for example, it was correct with
injectionTicks.value(“ticks”) = injectionValue
injectionyxAxes.add injectionTicks
injectionScales.value(“xAxes”) = injectionyxAxes
as lot of documents on many threads.
but it have to be like above
injectionTicks.value(“ticks”) = injectionValue
'injectionyxAxes.add injectionTicks
injectionScales.value(“x”) = injectionTicks
not “.add”, just input.
the reason is
before
xAxes: [{
ticks: {
autoSkip: true,
maxTicksLimit: 4
}
}]
now
x: {
ticks: {
autoSkip: true,
maxTicksLimit: 4
}
}
thank you 
i hope its helpful to who suffered from override options.
3 Likes