I have been messing with this too long looking for answers. I have tried override options I have found on the forums and none seem to work.
I am using Xojo Cloud.
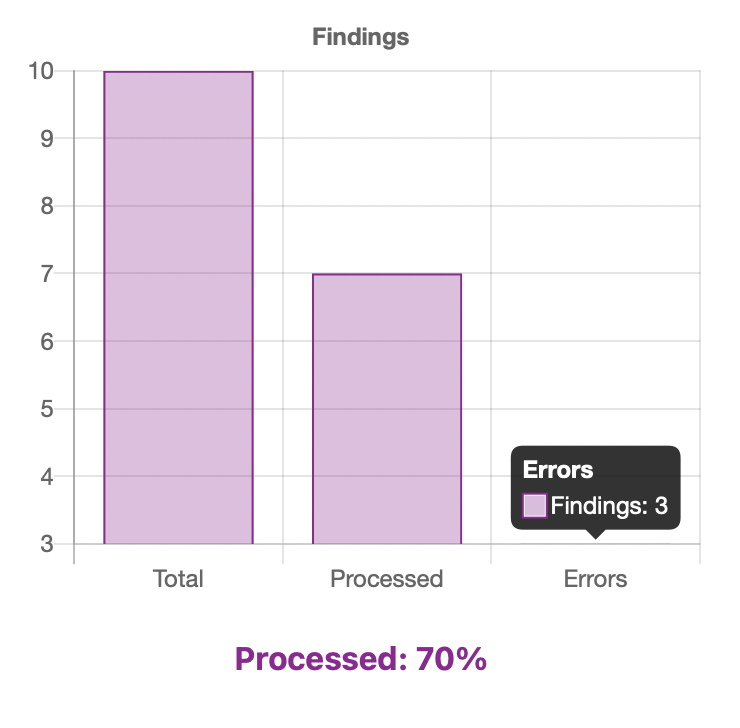
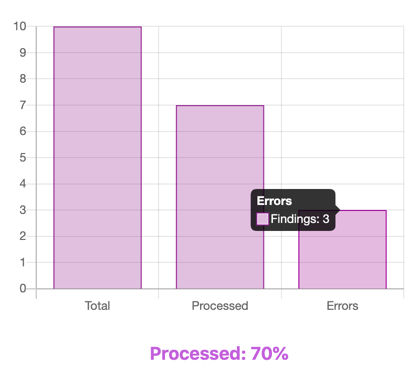
As you can see from the picture, The errors bar looks like its zero because the minimum is set to the lowest automatically. Any ideas on how I can get the minimum set to a fixed zero?
//IN SHOWN
Me.RemoveAllDatasets
Me.RemoveAllLabels

dim totalFindings as Double = UserPage.FindingsPage1.RecordCount.Text.ToDouble
dim processedFindings as Double = UserPage.FindingsPage1.FinishedCount.Text.ToDouble

dim errors as Double = totalFindings - processedFindings

Var findingStats() As Double = Array(totalFindings, processedFindings, errors)
Var ds As New WebChartLinearDataset("Findings", &c942193, True, findingStats)
Me.AddDataset(ds)
Me.AddLabels("Total", "Processed", "Errors")

dim percent as double = (processedFindings / totalFindings)*100

FindingsLabel.Text = "Processed: " + percent.ToString + "%"