Is there a solution to recover the old WebCharts code (before release 2023.2)?
70% of the browsers used by my users can no longer see the charts since the last update (yet some browsers are less than 6 months old - Samsung Flip for example).
Or are there programs to do what webcharts do from a canvas?
This is quite catastrophic because the list of compatible browsers is so small that even Samsung Flip screens whose last update was a few months ago can no longer display the new webcharts while everything else works perfectly.
In the end, I am forced to return to version 2023.1 only for WebApp development.
What a frustration!
And in addition, I had to apologize to my most loyal users for this regression, which is perfectly untestable given the extent of the problem.
To say that I develop applications that fight against the obsolescence of home automation systems… and that it is now my customers’ equipment that I have to place in obsolescence.
The ChartJS website says it works on “all modern and up to date browsers” and goes on to thank a service for letting them test thousands of browsers. (source)
Have you done any debugging to see why your charts have stopped displaying? That would be my first step.
Edit: Curious where you saw a list of compatible browsers, because I can’t find one and this seems like useful information to know!
If you can create a sample project with a chart that works with 2023r1.1 and not in 2023r2 and a list of devices/browser that doesn’t work anymore, upload that to xojo.com/issues and @Ricardo_Cruz can take a look.
Maybe a bug is affecting your code to affect 70% of the browsers used by your users and something can be done for R3.
I would create an Issue anyway. Ricardo may see if something can be done.
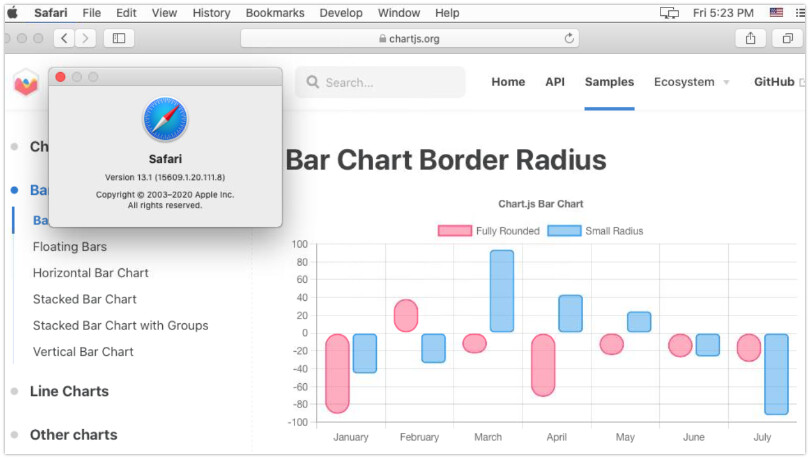
Can you visit Bar Chart Border Radius | Chart.js (for example) with one of the not working browser to check if the chart is displayed? If not, then chartjs is no longer compatible, if yes, then Ricardo needs to see what is the problem.
I followed the chartjs website instruction to run npx browserlist to see what they say they actually support, here is the output (as of today on the master branch):
Which means it may be a known consideration that Safari 13 is unsupported. I’m not sure what version of Chrome the Flip is running, but if it’s not on this list that may be a problem.