In latest beta (this is happening in latest release version too), I was finally able to get debug app running in Xojo 2025r1.1 to present the same behavior I noted here: Xojo Web App Just Freezes (no errors, no crashses)
I’m debugging on MacOS 15.4.1 and compiled app which exhibits same issue is running on Windows Server 2019, so I don’t think this is OS related?
Best I can tell:
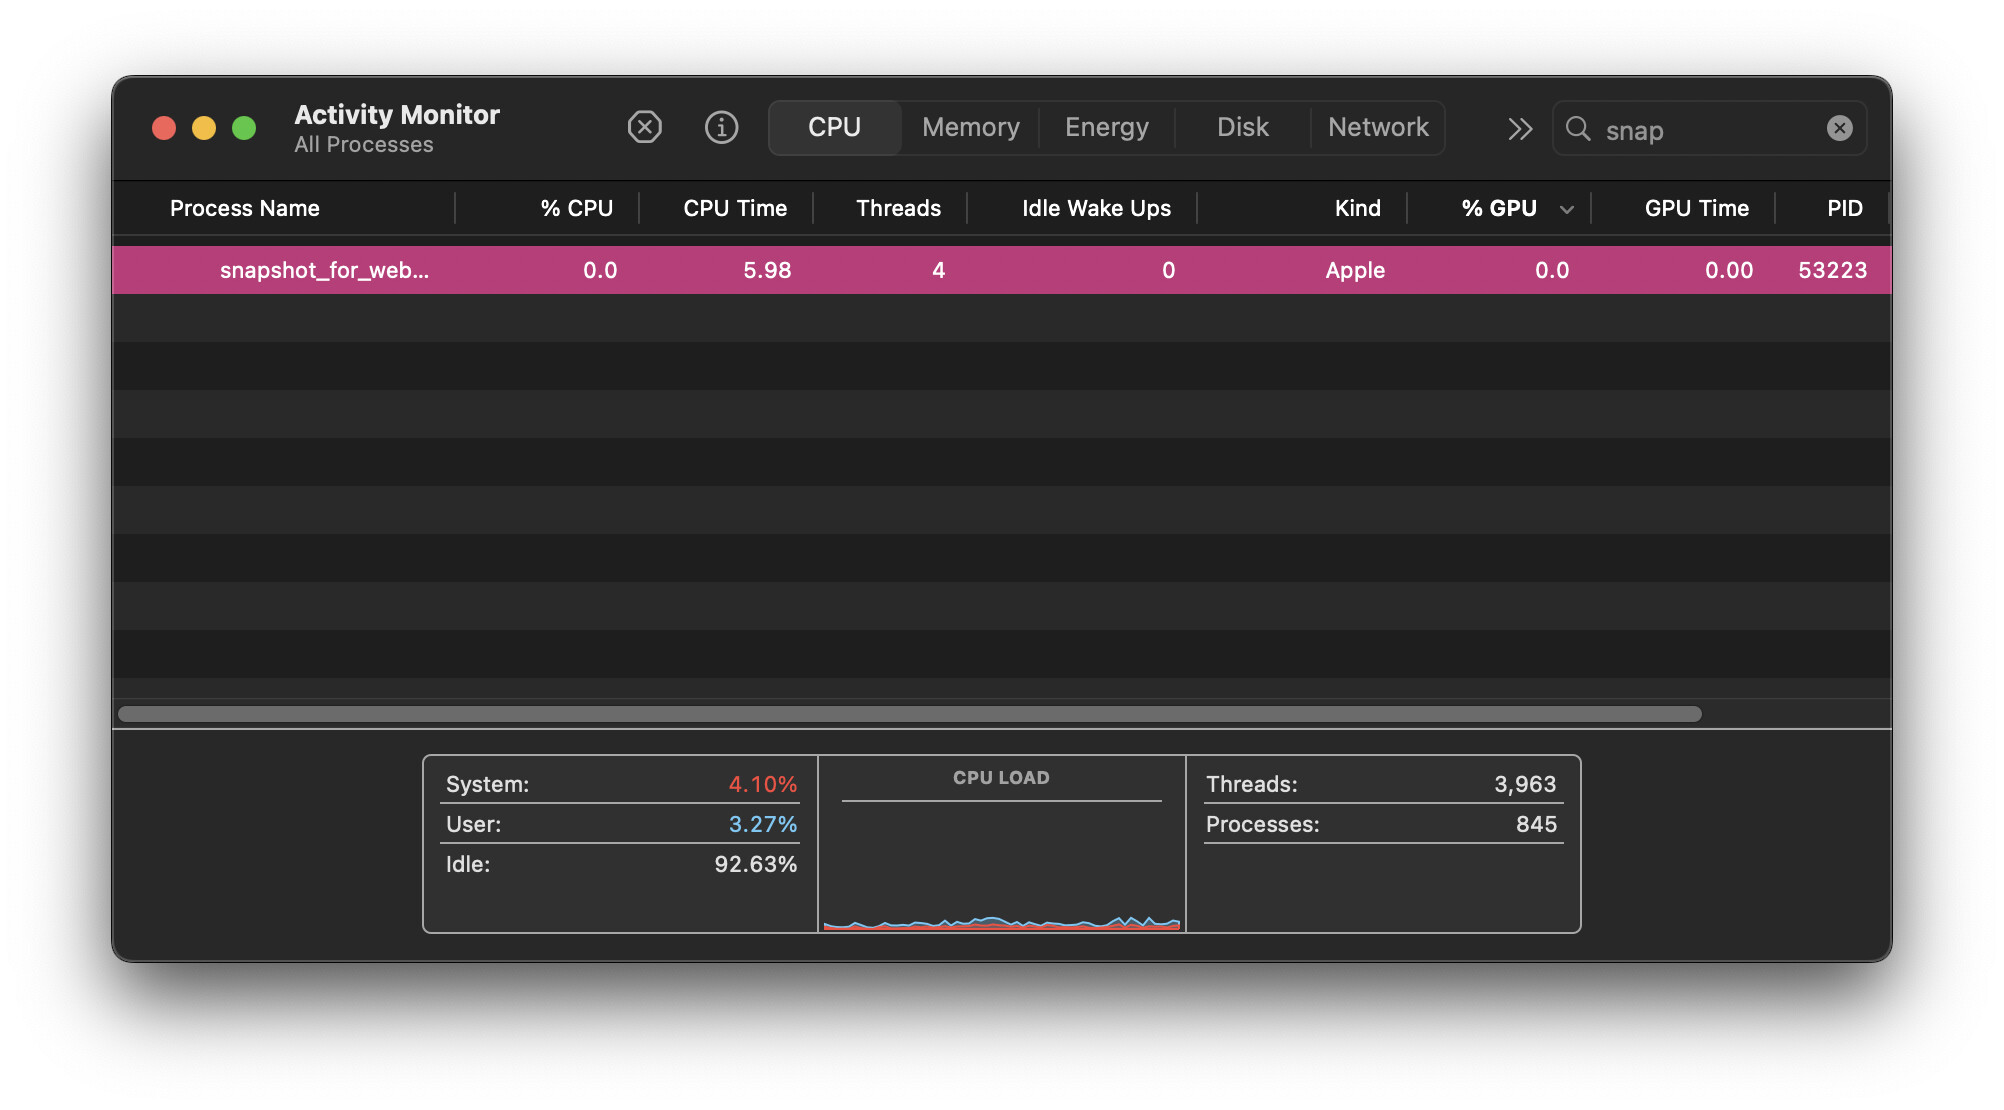
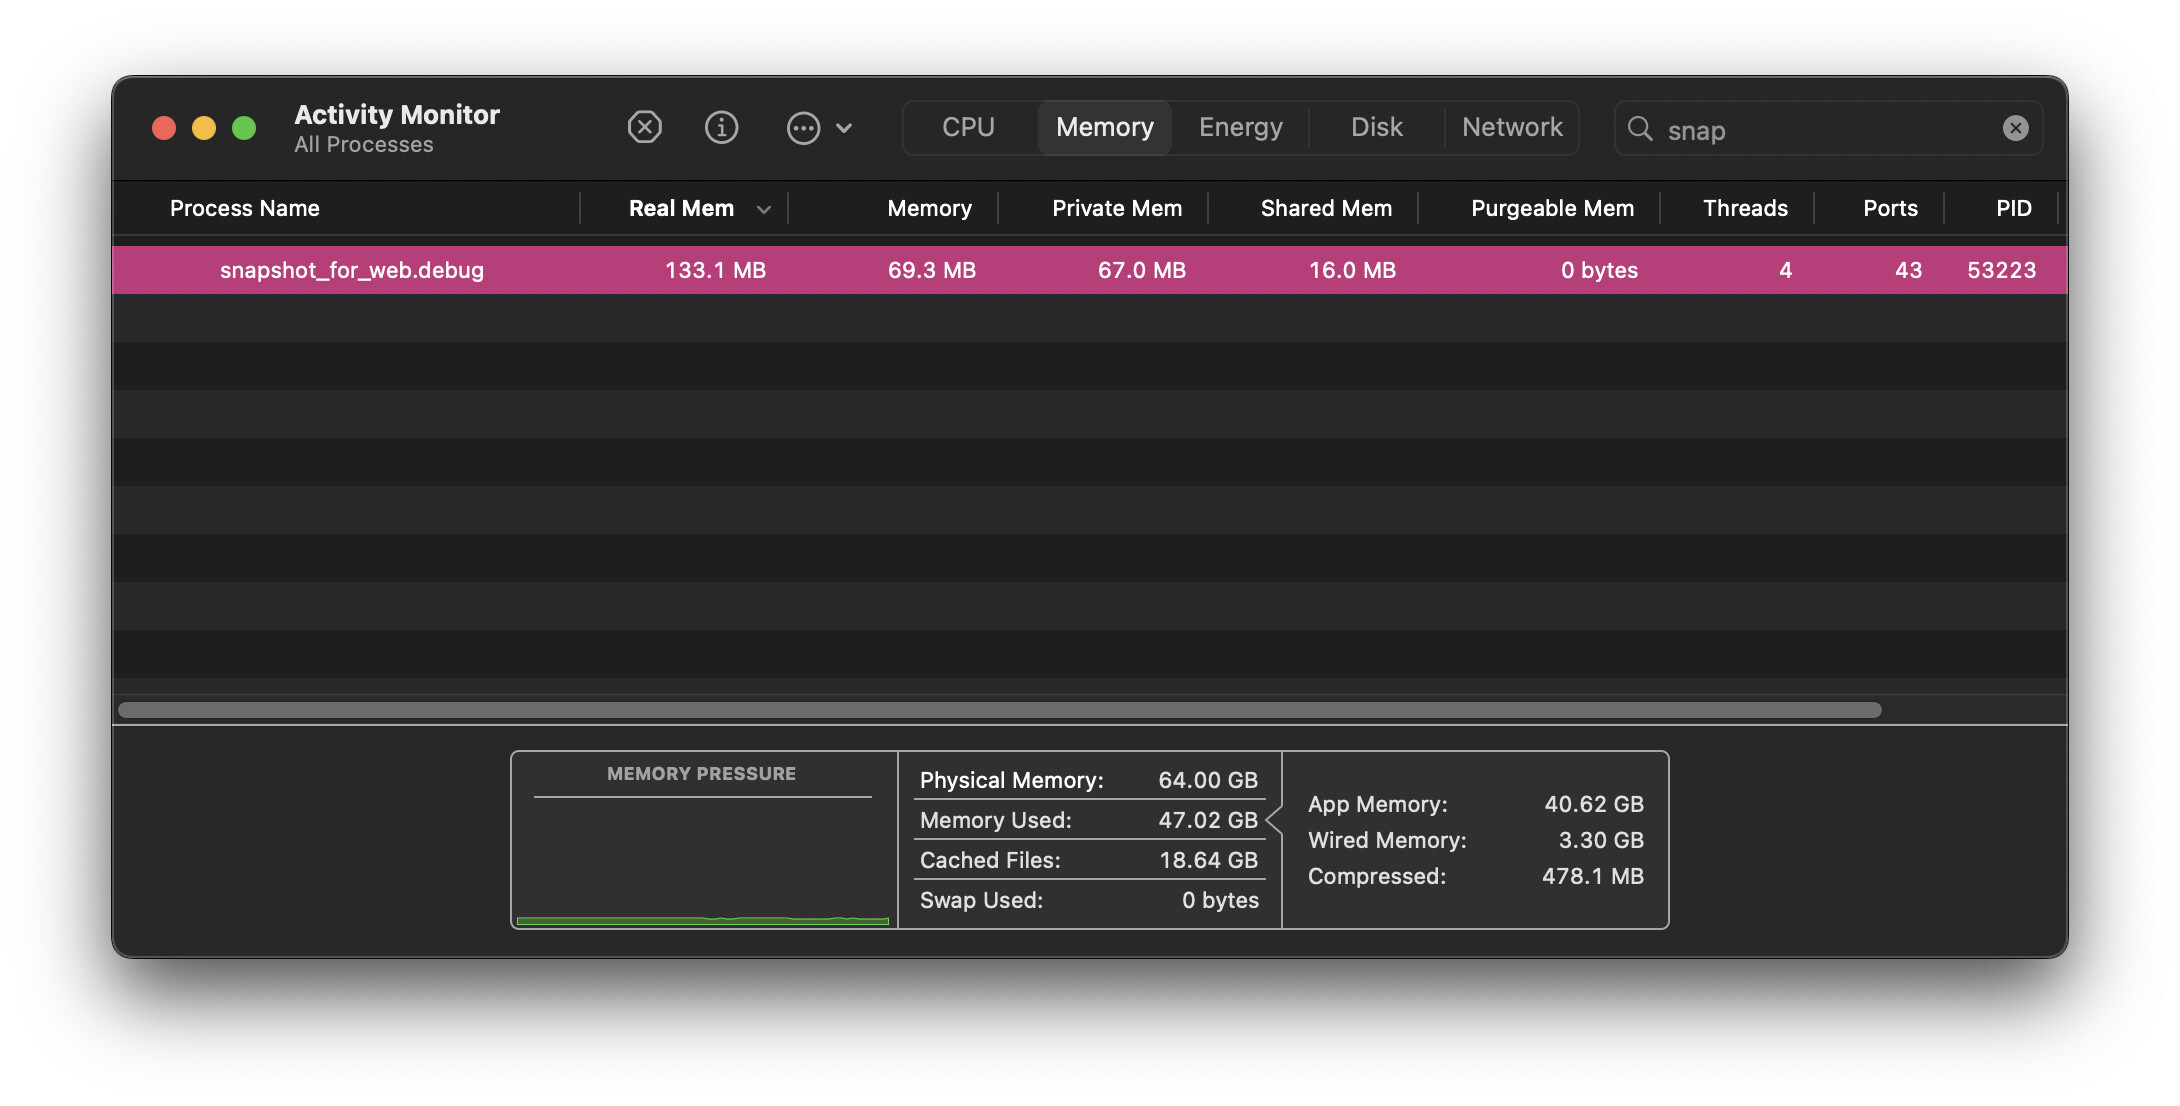
The Web App is not hung (Instruments app confirms this)
The Web App is totally non-responsive (no pages will load)
No Exceptions have occurred
IDE is totally non responsive
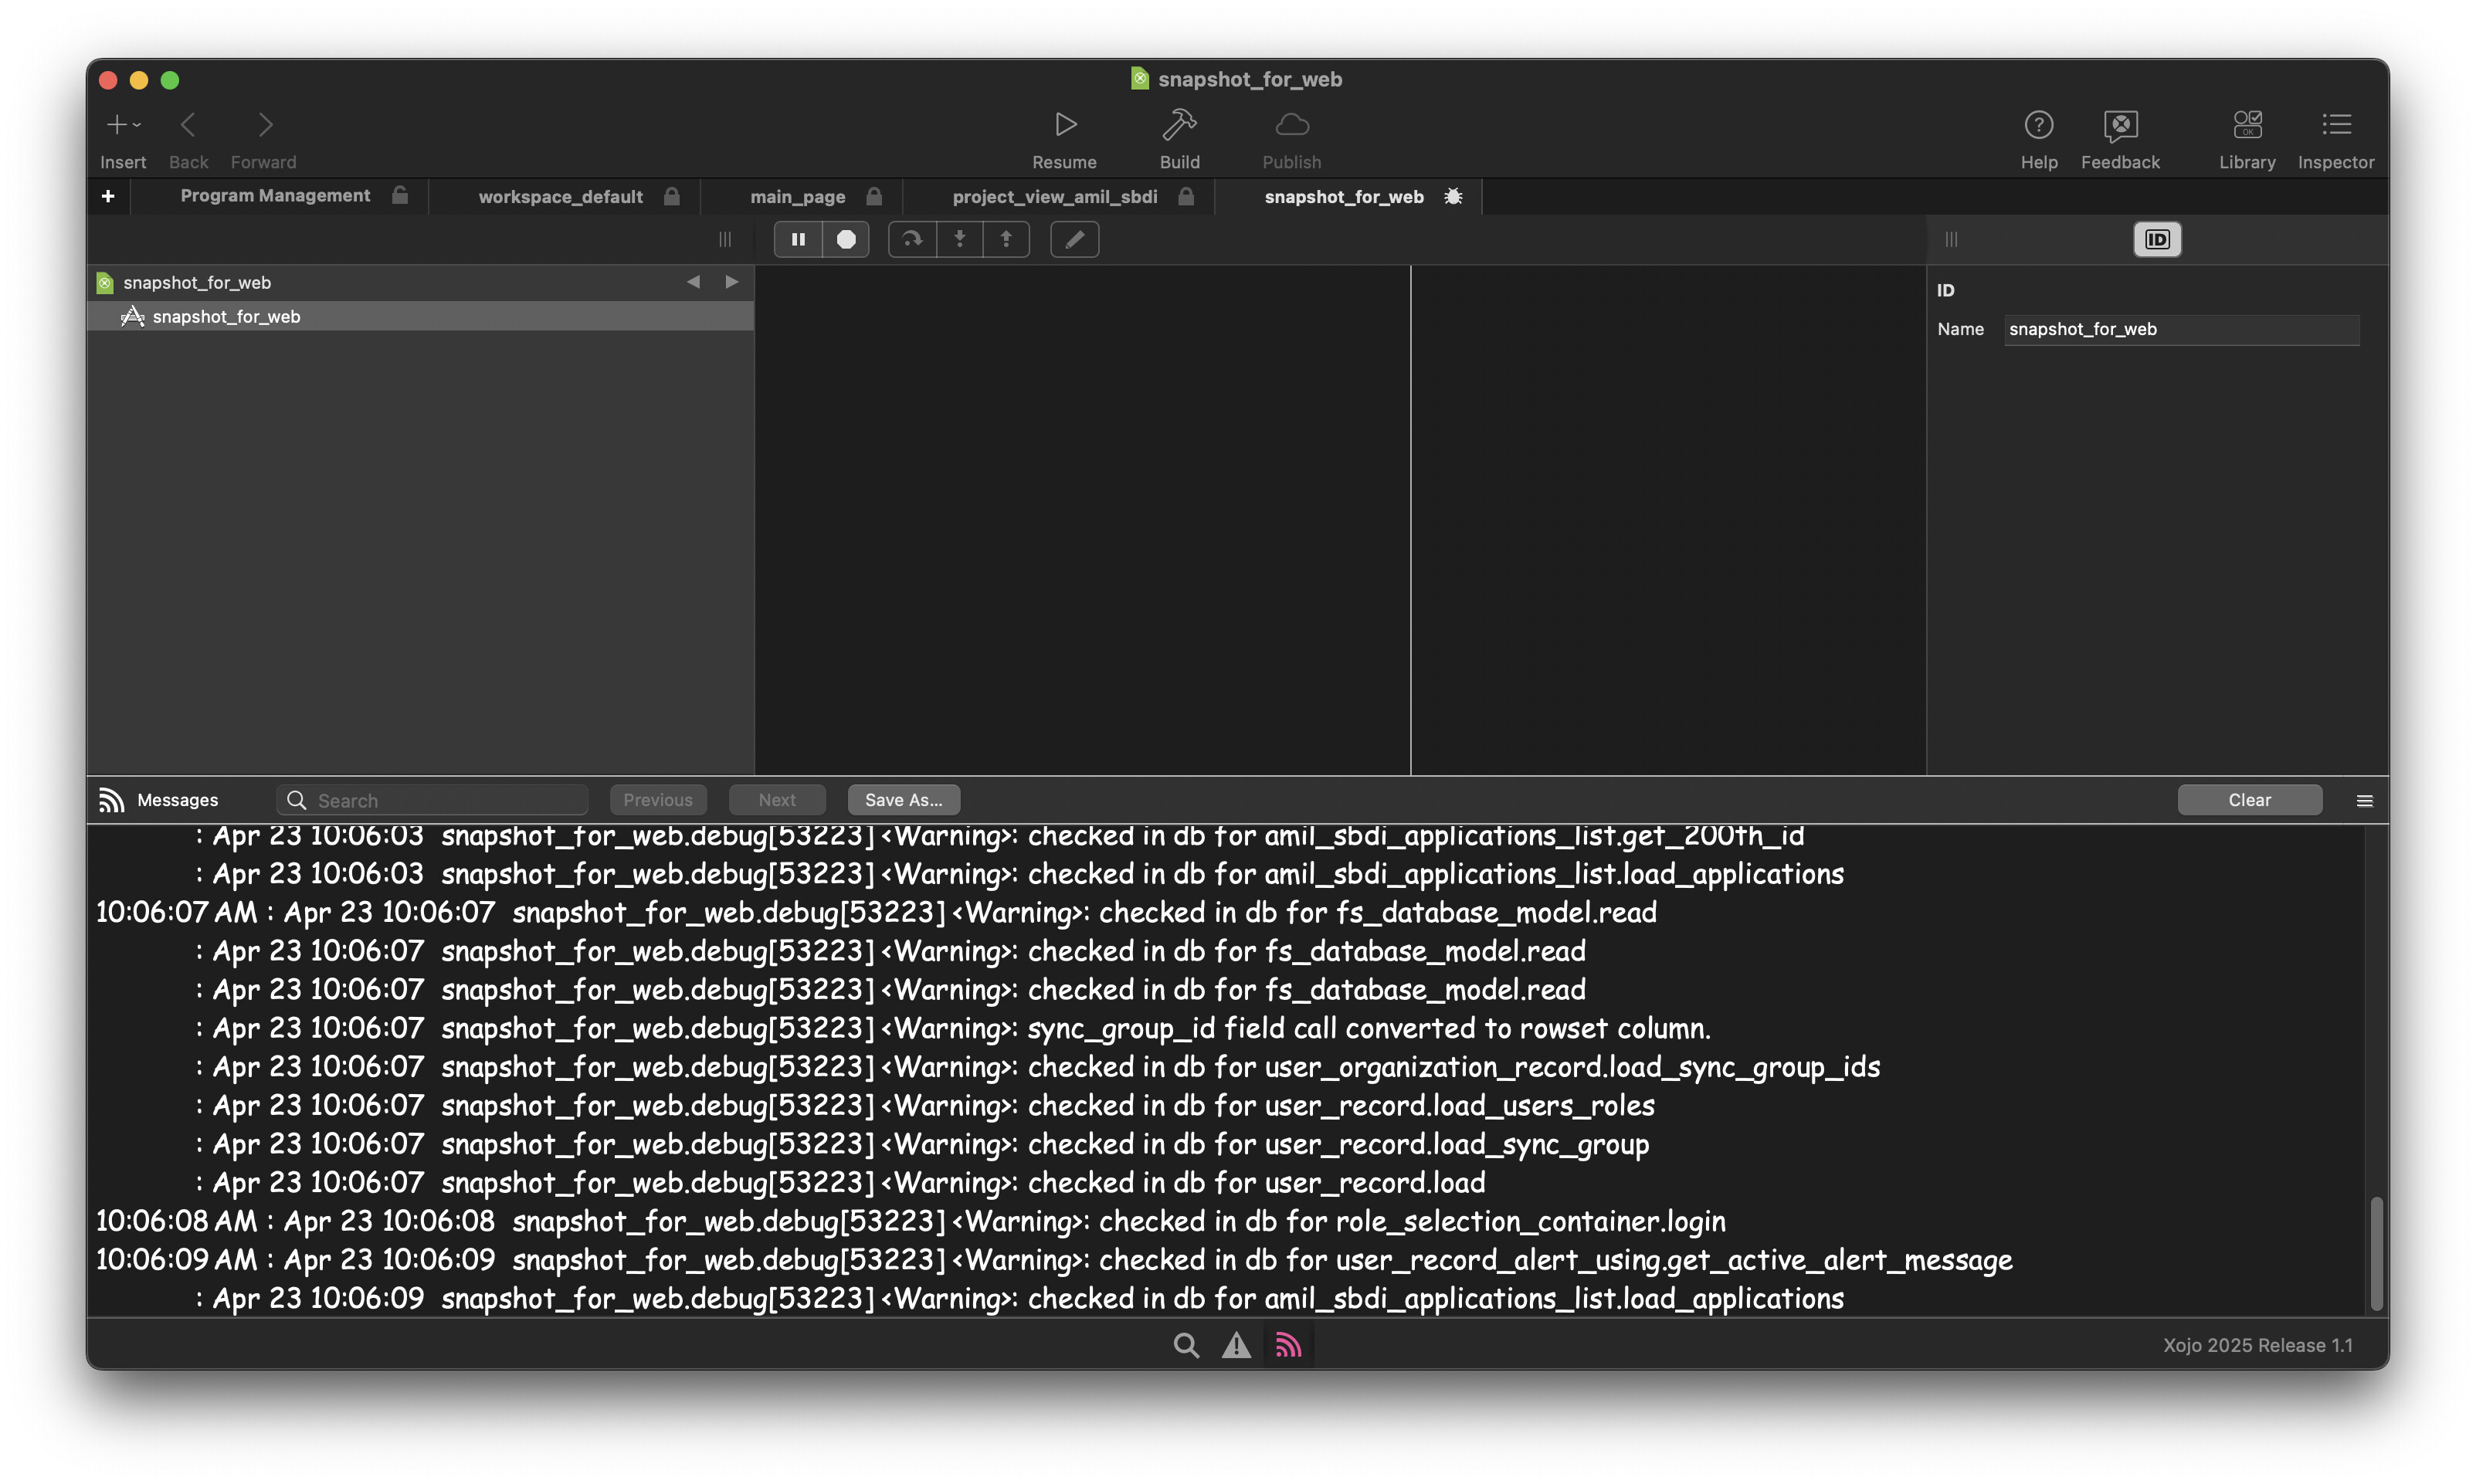
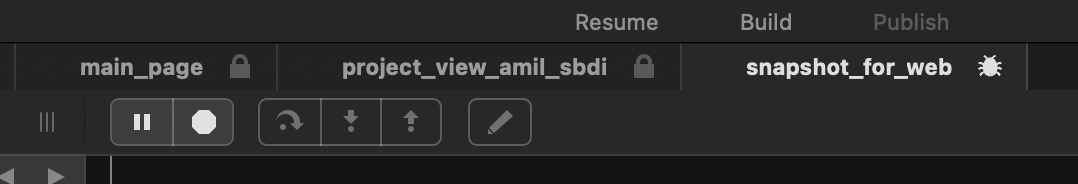
** pause doesn’t work
** no way to see what code is currently executing
Firefox shows no page data in inspector
It “feels” like somehow the Web Framework has reached an exit condition where it’s no longer in it’s “main loop”??
This is causing real issues for my customers which I’m mostly mitigating by using load balancing and multiple instances (which means it’s costing us extra $$$). If the app was crashing, it would restart, but instead, it requires me to manually stop and start the non-responsive process (which requires killing the process on Windows; it won’t stop normally.)
This is a very real issue to me, so any insight, assistance would be greatly appreciated.
Thanks so much,
Anthony
cc: @Anthony_G_Cyphers since he mentioned having similar issues with Graffiti Suite demoing site on newer Xojo Web builds.
I believe I would have to close the project tab; I’m holding off on doing so just in case you reply and want me to check anything on the running process.
I’m leaving the process up, in case one of the Xojo engineers would like to do a screenshare to look at the running IDE/web app process. From previous experience, it won’t crash over time, so I’ll try and leave it up most of the day.
You can reach out at the email associated with my Xojo account (or here on this forum)
It’s a very intermittent issue, which only happens somewhere between maybe once every 15 days on average, so I was just “lucky” catching it in the debugger. (I never have before)
So IMHO, opening a private case will likely just lead to non-reproducible. I’ll wait back to hear from Xojo team.
p.s. - very much appreciate the great support you provide in the forums. You’re a forum in my book.
Hi @Anthony_Dellos, that looks like a deadlock happening for some reason.
Are you using Threads, Critical Sections, Semaphores or something else that could be blocking your app in that way? Or maybe a Timer, Shell or something that works synchronously that could be blocking the Main Thread?
As I said in your other thread, I was never able to determine the cause but it’s stopped happening now. In my case, I was running two instances of the built app and both seemed to “die” at the same time, approximately (but not exactly) 24 hours after starting. It wasn’t nginx because I was still getting 503s and made no changes to the server configuration between when I saw the lock up and when it stopped happening. It wasn’t related to system config or cron because those didn’t change either.
@Ricardo_Cruz - I didn’t think user code, even if it’s a thread, could leave the IDE in a state where neither the pause nor stop buttons work any more?
(these buttons no longer do anything when the issue occurs)
That’s why I thought this might be a framework issue.
If that’s not the case, I’ll look closely at thread and critical section use.
To get the issue to happen in the debugger, I had to open many sessions on various devices and “spam click” various parts of the UI on those devices to cause the “lock” to occur.
The real app can have upwards of 50 simultaneous users actively using the app (hundreds of users, but it’s very rare to have them all logged in at the same time)
Yeah we’re not getting that kind of traffic, but that’s an important fact to give Xojo.
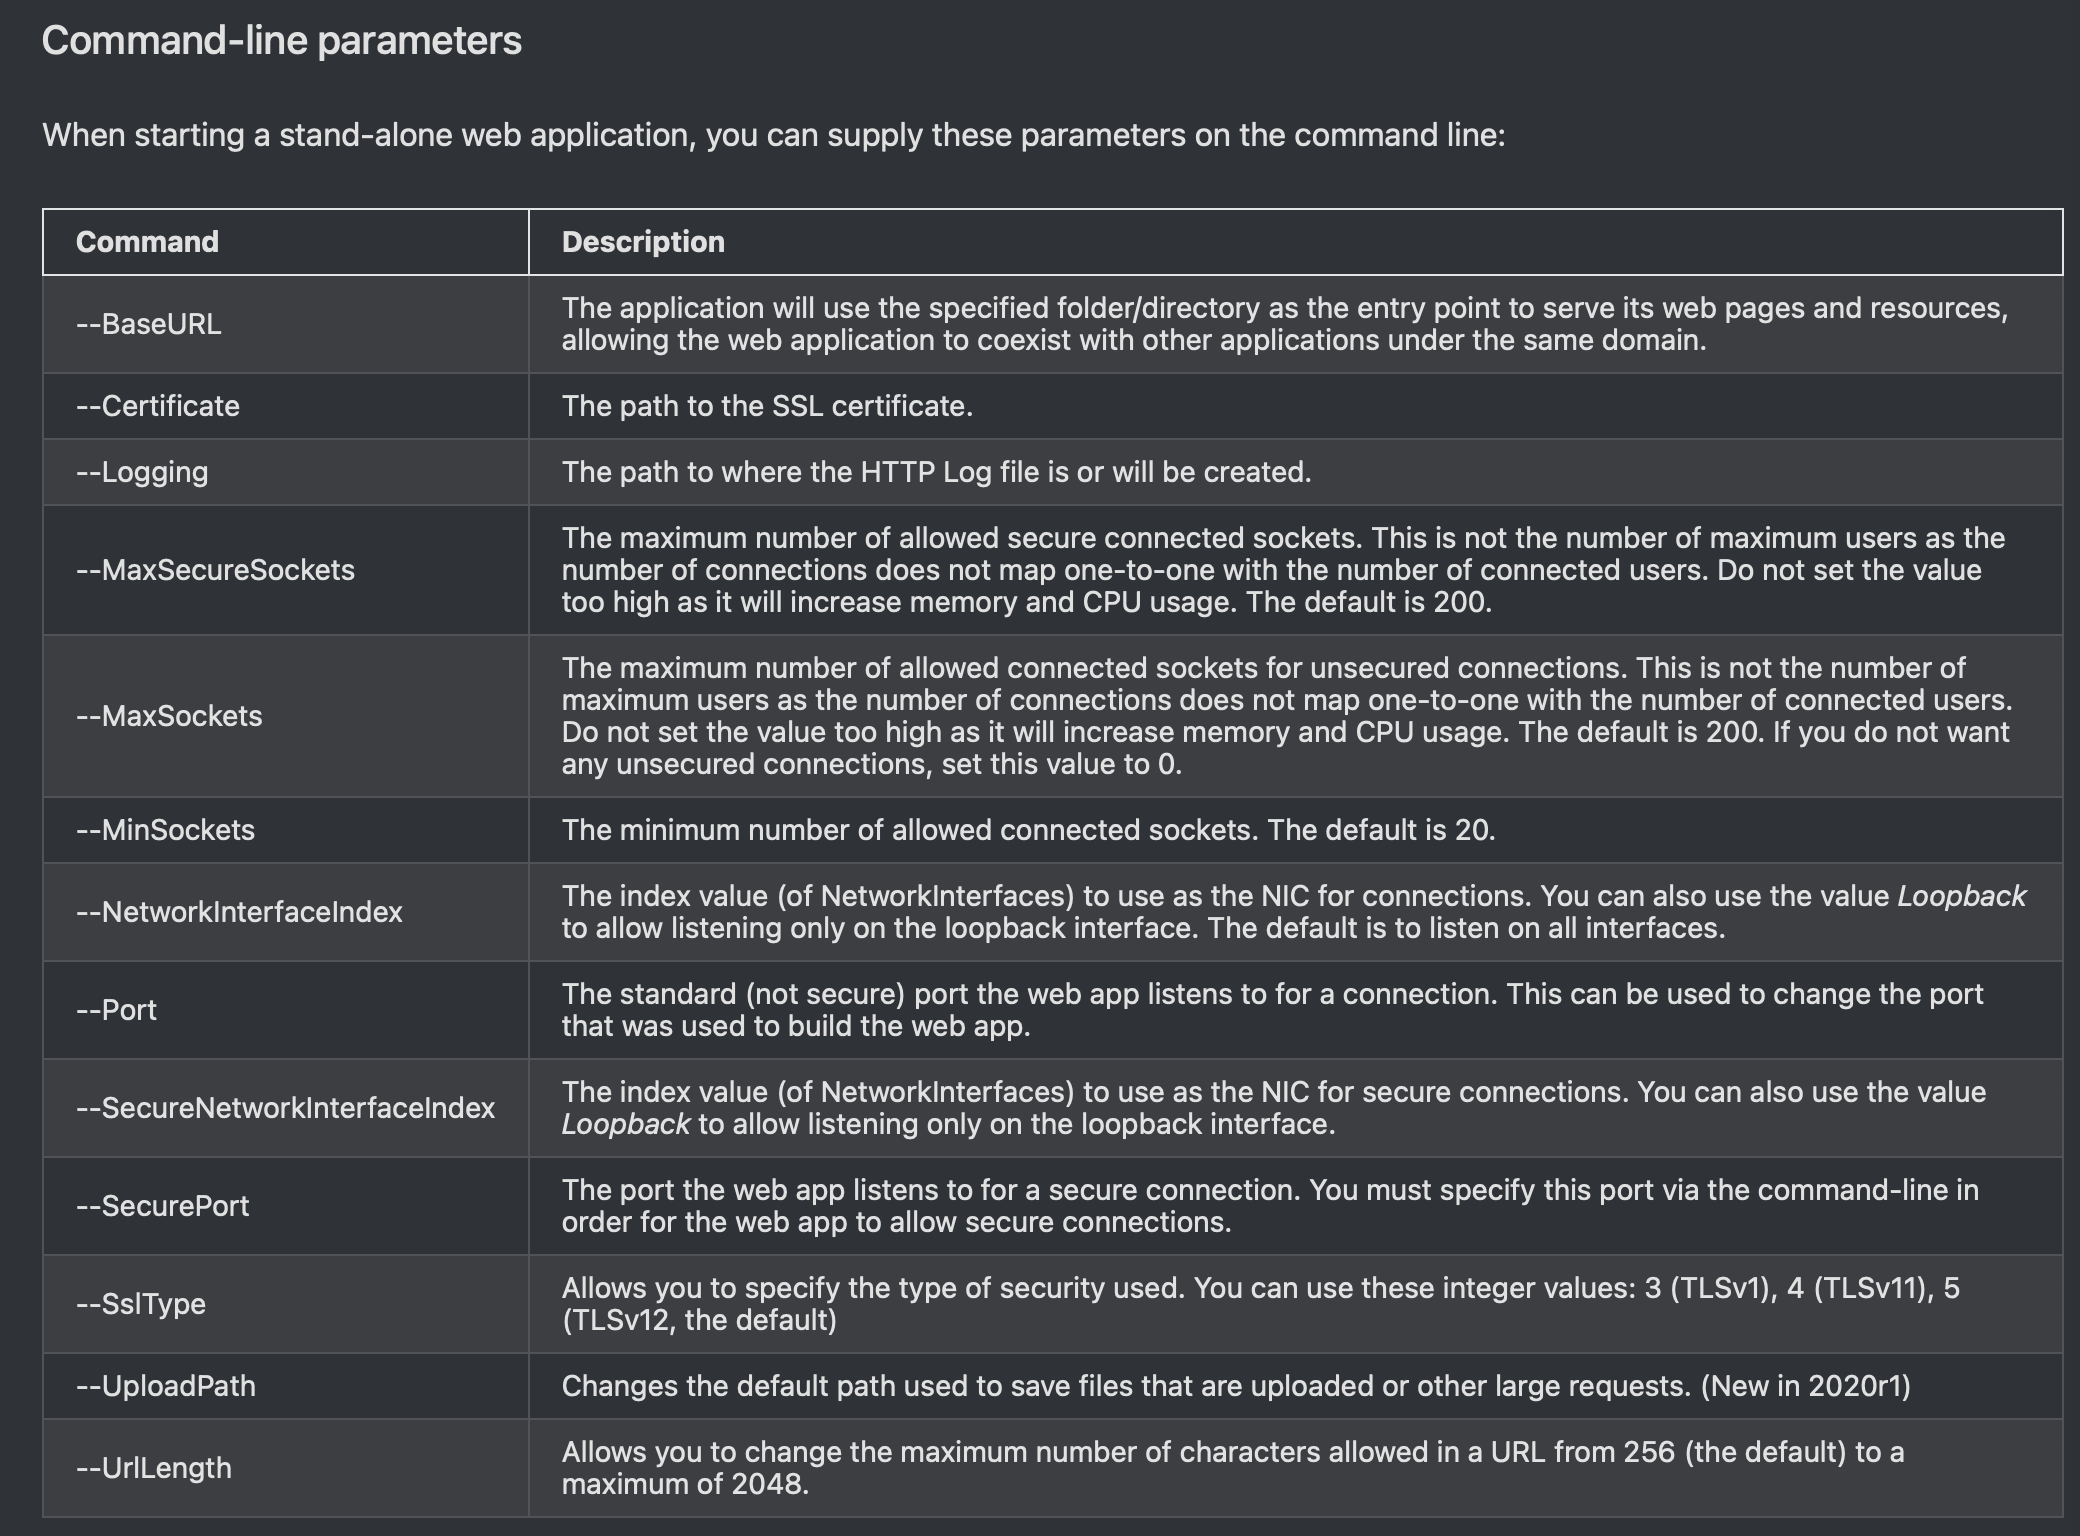
That said, make sure you are setting the maximum number of connections. If you’re spamming the app, you could easily use up the default which is (IIRC) 200 because they might not get released by the OS immediately.
Update: Adjusting the max sockets value did not resolve the issue.
Since I can now reliably reproduce the same non-responsive state when debugging the app, I’m putting together an as-trimmed-down-as-possible example project that still demonstrates the problem.
I will submit a case as soon as I have the project ready, and will include instructions for causing the non-responsive state.
@Anthony_Dellos I am following this thread with interest. I have a very similar issue that began just this week. Debug build is fine. Build on Windows 11 for Linux is non responsive once installed on Debian 12.10, but not crashed or hung. Logs for the non responsive app are not different than logs for a previous build that works fine. It is a low traffic application, where the max socket hypothesis would not apply. I am also trying to get a better handle on the problem.
No.
I am now setting up a Debian 12.10 dev computer. Maybe I will have a better idea building on that machine, closer to the production environment (the production environment is a Debian 12.10 VM, on Proxmox). I am at the stage of eliminating hypothesis, one by one.
I am certainly careful making rash opinions on the issue because in the past, I had issues on the Prod environment that I did not have on the DEV environment. It turned out to be entirely my fault. Old buggy code that never acted up until I made changes to a related functionality. It could be the same, or not. So, like I said, I don’t want to assume anything. Just troubleshooting methodically - as much as I know how
If I find anything of any relevance, I will post here. in the mean time, best of luck to both of us.