I am running 3 web apps on AWS Lightsail instance, using Lifeboat and I am sharing this to see if anyone else has experienced anything similar?
Normally my Lightsail server runs at around 3-6% CPU utilisation, and might hit 10% during peak business hours time, which is harmless. So i do not think I need to upgrade my instance. Then suddenly it will jump up to 60-80-100% and sustain that. I have alarms set, but when it triggers, the entire server is unresponsive so troubleshooting is impossible. I can only Stop and Start the Instance, (reboot doesnt work).
When I run TOP in normal circumstances, my busiest web app starts at around 5% memory utilisation then after about 5 days that increases to the 50’s and hovers up and down at that level, and gives no indications of any impending troubles.
a pattern is beginning to emerge, this event has occurred in these exact time gaps in days. 8,20,13,12,10,10,11. (it happened a few times before but i since upgraded the instance to a more powerful one). I have let it run its course for long enough to be sure its not going to got away, and seems now I can set my watch to it. It doesnt always occur during our websites busiest times (we are B2B so we dont expect much site traffic outside of business hours).
I could try rebooting the instance daily (or weekly) but thats only a bandaid.
I will run a script to write the output of TOP to a file and see if I can catch its last entry before the instance carks it.
If you can set your watch by it, then it sounds like it might be a cron job that’s causing the issue. I don’t know of any timed mechanisms within the Xojo framework that would provide a similar effect.
it’s an exaggeration that I can set my watch to it - it never occurs at the same time of day/hour. It seems now that its settle to occur every 10-11 days. which would make one think I should know when to watch it…
Ah, OK. Sorry for the noise, then. Maybe @Tim_Parnell can help out.
For what it’s worth, I usually have a weekly cron job on my servers that runs at a weekend off-peak time to perform maintenance and restart apps. I don’t, however, use Lightsail or Lifeboat (currently).
Have you tried a swapfile? This seemed to help mitigate the mysterious Xojo Web Eats Up 100% of the CPU issue that I had been investigating earlier this year. My only other workaround was to set up EC2 instances and have CloudWatch do a reboot when the CPU spiked. That doubled the cost of hosting a Xojo Web app.
My web app deployment tool called Lifeboat can help you set up a swapfile for your instance as well as tons of other useful things. Might be worth checking out if you haven’t already
Yep I have a swapfile, I am the guy who suggested you add that feature to lifeboat.
Thanks for cloudwatch suggestion, I don’t need to go there yet as I can act on it quickly enough from the alerts. Long term I may need to, or run a 2nd instance for failover. either way it doubles the cost.
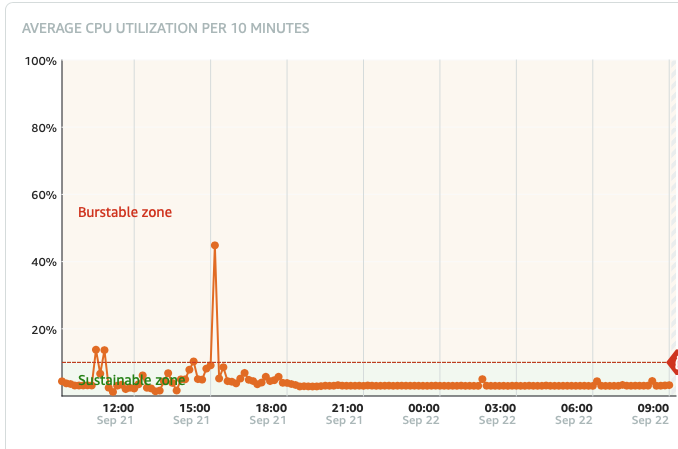
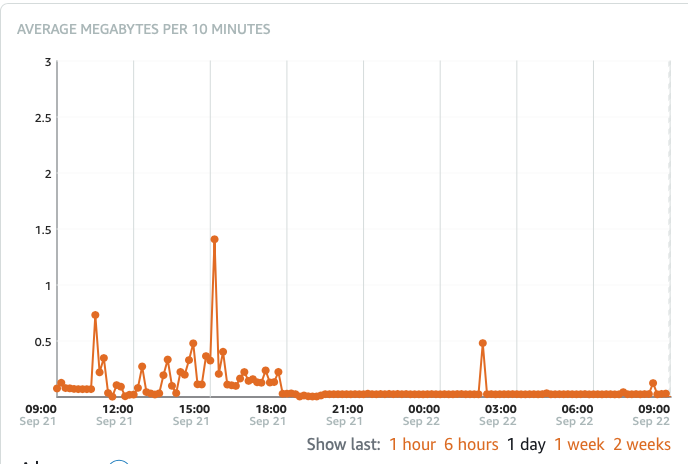
Something interesting happened yesterday, at 3.00pm about 3 hours after I had to restart it, I had Top running in the shell window just in case and I casually noticed my webapp suddenly jumped to 95% CPU for a good 10 mins or so, then dropped back to normal. Memory use peaked around 25%, This is the first time thats ever happened (that I have seen)
This also coincided with a equally big spike in Inbound Network traffic. I have never noticed this correlation before as the instance normally falls over so stops reporting metrics too soon.
So there is my clue, either too many clients at once or some nefarious rogue - I am leaning towards the latter. I am getting my developer to add the google analytics code to the app, so I can get some details about that.
I’m seeing CPU problems on macOS, and I wonder if they are related.
Scenario: a Web2 app built with Xojo 2021 R2.1, which has been running succesfully for over a week, with both light and heavy usage.
At the moment, there are no sessions connected, and yet the app is idling at about 32% CPU usage. A sample shows this:
Yeah sorry, I don’t have a heck of a lot more information.
In my cases, I also believe it was HandleURL related. In one instance possibly a bad actor(s), but I didn’t want to jump that far with an app I literally just turned on (new instance, new domain).
When experiencing this, the instance gets locked up and I have to force shut down to regain control on EC2. I haven’t seen many issues since adding the swapfile (thanks for that awesome suggestion). Still, it was a non-zero number.
Would love more information, or experiences with this issue if you have any!
Well the next ‘predictable’ cycle of 10/11 days came up last week, and I was watching carefully and running Top and saving to a text file and guess what? It knew I was watching so it didnt happen, so none the wiser at this time.
I just rebooted it today, as it needed to complete a kernel update, and the "idle’ CPU % dropped from a constant ~5% to ~1.5%
Mike, I shared your info with my programmer (who is not me) and he doesnt relate to any of that.
Maybe I will just reboot this daily or weekly. I was going to resort to doing that anyway, but it looks like I wont be able to solve this.