Please bear with me in advance for what is probably a stupid question. I have now occasionally built the odd test project in Xojo, and always a test run was a simple affair. At the moment I am tinkering with a desktop application, adding a simple method to the app (though not to the “Window1” object), say: displaying a MessageBox. Unfortunately, when I click on “Run”, the window always opens, although I actually only wanted to test the code in the method. Isn’t there something like a simple “direct window” in the IDE, like in VBA (with “Debug.Print”), which really only executes a certain method or writes content in a code window?
OK, I think I am one step further. Open the window via “IDE Scripts > New IDE Script”. You enter the code, then the command “Print…” and get a MessageBox that displays this text. But can’t I use the constructs “Sub Test()…”? End Sub" or “Function Test()…”. End Function"? This is also a common synonym in Xojo for methods with and without a return value.
Try:
https://documentation.xojo.com/api/os/system.html#system-debuglog
Also, the default window will always open. For me, that is generally fine but look into the docs for Window to see what the story with the default window is.
You can also use a Breakpoint and step through the code to se the values of the variables
If you don’t want the Window displayed when you start the app, then simply select the App item in the Navigator and then “none” from the “Default Window” popupmenu in the Inspector Panel.
Thank you for this information. I’ll take a close look at it.
Unfortunately, I have not yet been able to do this without opening the window. But now I have found the script input window under “New IDE Script” and the display works perfectly. However, I can’t seem to set any breakpoints there.
Why are you doing that with an IDE script? You should put the code in the App’s Open event handler. Where you will be able to set breakpoints.
(I’ve never used an IDE script).
Nice tip. This is an interesting “add in” and certainly worth a try. Thank you very much!
Thank you, this suppresses the display of the window and is already a help.
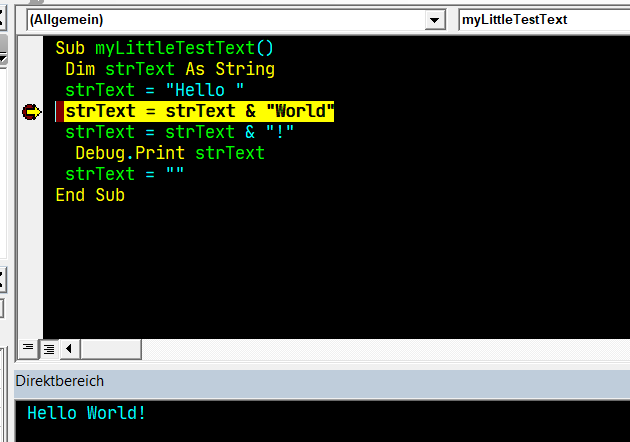
Thank you, I am well aware of that. However, I know from other programming languages - even in the relatively simple VBE - the possibility to monitor individual steps and, among other things, the change of variable values via breakpoints and occasionally print outputs in the so-called “direct window”, which saves me the start of objects by means of their events.
See example VBA below.
For testing purposes, there’s nothing wrong with using the app’s Open event and putting the code there, where you will be able to set breakpoints.
Never having used IDE scripting, I don’t know how/whether breakpoints can be set in an IDE script.
Thank you, I understood that. I already regularly use the code input windows including breakpoints that are connected to the events. Then I will have to come to terms with the fact that there is no such functionality as the “watch window” or “direct window” (in the IDE of other languages) in Xojo.
the shortest way is to act on the command line argument in the app open event.
i also create menüs for developer to open special test windows.
most useful as already mentioned is System.DebugLog and CurrentMethodName
this variables window in debug mode is enough for myself.
otherwise there are much options to log a value somewhere.
helpful is also the use of break keyword after a condition.
If System.CommandLine.IndexOf(0,"test", ComparisonOptions.CaseInsensitive) >=0 Then
1 Like
The simplest way is to set the default window in App to None and create an App.Open Event Handler to run your code. Have a look at https://www.dropbox.com/s/4525cihixasnje7/Simple%20Debug.xojo_binary_project?dl=1 to see how I’ve done it. You’ll need to open the debug pane in the IDE
to see the output.
That’s exactly it! Thank you, now it works as intended and I understood that you have to use the formulation “System.DebugLog(strText)” and not: “Print strText”. And I have been looking in vain for the “Debug Pane” under the “View” menu for a long time…
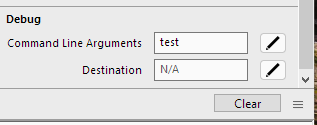
I could understand that. I now write the code to be tested in the open event of the app. And that also works well. You also show a screenshot in which the input fields “Command Line Arguments” and “Destination” can be seen. Can you still tell me how I get to this view?
Have a look in Shared Build Settings.
That seems like overkill for a throwaway test app. Whenever I’m testing code just to see how it works, I create a test app and put the code in the Open event of the window, with a breakpoint. The window never shows (it hasn’t got that far) and I can step through the code and stop the debug run before the window shows on screen.
2 Likes