Did you know that you can leave the Profile Code option on when you compile your app? It will create a text file upon quitting that app that contains the same information you can get when you profile your code within the IDE.
Unfortunately, as a text file, it’s a bit hard to decipher and the IDE is no help, so I wrote an app that does the job. It reads and displays those files, and even manages them for you.
Some features:
- Manages the Profile.txt files for you. Open one and it monitors that folder for others, renaming them with the date/time from within the file as it finds them.
- New files appear in the browser as you create them and vanish as you delete them. You can also delete or reveal them from within the app.
- The hierarchical list will display the stats in a logical way. Just like the IDE, it will show how much time a particular method has taken independently of its children.
- Mimics the IDE behavior including the way lines are highlighted for a familiar feel.
- Unlike the IDE, it splits the threads so you can examine them independently.
- Intelligent sorting by almost any column.
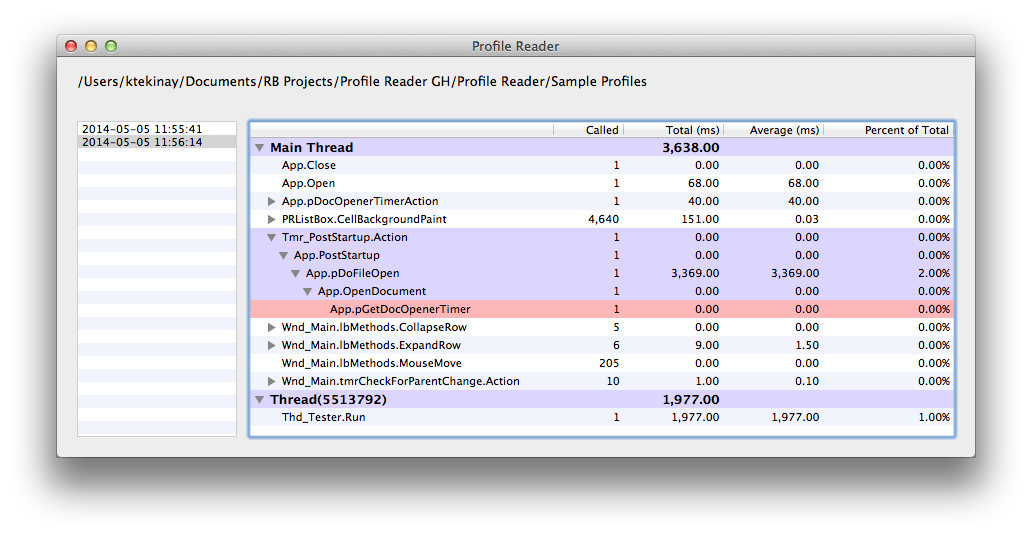
A screen shot:

Since I can’t imagine this has any commercial value, I’ve decided to make it open source and post it at my GitHub account here. Take a look at the Read Me there for more information.
Well, DropBox disabled public links so here is the screenshot.
Should now be Retina-compatible too, but I have no way of testing that adequately.
Now updated to work properly with Windows and Linux. The way files are opened (with a Timer started at App.Open), AutoQuit was forcing a quit as soon as the app launched.
Also for Linux, the control key is used to expand/collapse all rows. Option is used on the Mac and Alt for Windows. I have no idea if that’s the right way to do it on Linux, but Alt simply wasn’t working.
Silly question time - why do you use the timer to open files rather than just calling pDoFileOpen in the App.Open event?
I’ve had issues in the past with windows not forming completely when multiple documents are opened simultaneously so now, out of habit, I handle the opening of each document through an array and Timer. That allows one window to open and fully form before the next one opens.
Say, I should really turn that into a class…
I just tried the profile reader and it doesn’t seem to work for me (on Mavericks, Dutch Language).
I debugged as far as I can get and what I found is this:
ProfileDocument.Constructor has a line that says if data.threadname = "" then continue //shouldn't happen
Unfortunately for me it does happen.
I dug a bit further and looked in the constructor of ProfileLineData
There a match is made through rx.search(text)
The match always returns nil.
An example of one of the profile lines is:
Main Thread Bouwsoft.Open|1|0|00,00%
Unfortunately my regex knowledge is about non existing.
Could someone have a look at this please and tell me how to fix the SearchPattern.
The SearchPattern in the ProfileLineData Constructor is:
(?i-sUm)(?'thdname’Main Thread|Thread\(\d+\)) (?‘methods’.*)\|(?‘called’\d+)\|(?‘spent’\d+(?:\.\d+)?)\|(?'percent’100|\d{2}\.\d{2})%
Thanks in advance.
Aha 
Found it
rx.SearchPattern = _
“(?i-sUm)(?'thdname’Main Thread|Thread\(\d+\)) (?‘methods’.*)\|(?‘called’\d+)\|(?‘spent’\d+(?:\.\d+)?)\|(?'percent’100|\d” + _
“{2}\,\d{2})%”
The above works for me
Instead of the original code
rx.SearchPattern = _
“(?i-sUm)(?'thdname’Main Thread|Thread\(\d+\)) (?‘methods’.*)\|(?‘called’\d+)\|(?‘spent’\d+(?:\.\d+)?)\|(?'percent’100|\d” + _
“{2}\.\d{2})%”
The code didn’t take into account the international settings. We have 00,00% instead if 00.00%.
Hence the search pattern failed.
Maybe a fix is in order
Some more fixes
Adjusted the searchpattern again, because it didn’t add the values (everything was 0)
rx.SearchPattern = _
    "(?i-sUm)(?'thdname'Main Thread|Thread\\(\\d+\\)) (?'methods'.*)\\|(?'called'\\d+)\\|(?'spent'\\d+([b]?:\\,\\d+[/b])?)\\|(?'percent'100|\\d" + _
    "{2}\\,\\d{2})%"
Also adjusted the .Val to be .CDbl so that it takes international into account
So in the ProfileLineData Constructor:
TimesCalled = match.SubExpressionString( 3 ).CDbl
TimeSpent = match.SubExpressionString( 4 ).CDbl
PercentOfTotal = match.SubExpressionString( 5 ).CDbl
These were .Val, but that does not work the decimal sign is a comma.
Example of a line that needs to be processed: Main Thread myCodeTimer.Action|559|6618,00|00,01%
Thanks Dirk. Will you be doing a pull request to merge these changes, or should I just make them on my end?
Also, can you send me one of your profiles so I can add it to the samples?
Hi Kem,
Due to my workload I won’t be able to make the changes to the repo myself, so If you could do that, it would be appreciated.
Don’t forget that I only implemented a quickfix by changing the dots to commas. Somehow there needs to be a test for international settings and then it needs to be caught cleanly.
I’ll send you a private message about the profile.
[quote=88010:@Dirk Cleenwerck]Some more fixes
Adjusted the searchpattern again, because it didn’t add the values (everything was 0)
rx.SearchPattern = _
    "(?i-sUm)(?'thdname'Main Thread|Thread\\(\\d+\\)) (?'methods'.*)\\|(?'called'\\d+)\\|(?'spent'\\d+([b]?:\\,\\d+[/b])?)\\|(?'percent'100|\\d" + _
    "{2}\\,\\d{2})%"
Also adjusted the .Val to be .CDbl so that it takes international into account
So in the ProfileLineData Constructor:
TimesCalled = match.SubExpressionString( 3 ).CDbl
TimeSpent = match.SubExpressionString( 4 ).CDbl
PercentOfTotal = match.SubExpressionString( 5 ).CDbl
These were .Val, but that does not work the decimal sign is a comma.
Example of a line that needs to be processed: Main Thread myCodeTimer.Action|559|6618,00|00,01%[/quote]
How are you fixing this? By calling the system’s decimal separator and splitting by that or by taking a sample line and extracting whatever the decimal separator seems to be? The first is the “proper” one but the second ensures me sending a profile file to someone with a different locale would still make it readable.
I’m simply replacing the hard dot that’s there now \\. with a character class of either a dot or a comma [.,]. It doesn’t need to care which one is being used.
Thanks to Dirk’s file, I was able to confirm that this pattern will work internationally. I’ve also made some other changes to make it more flexible and readable.
(?x)				# FREE-SPACING
^
(?'thdname'Main\\x20Thread|Thread\\(\\d+\\))
\\x20
(?'methods'[^|\\r\
]*)
\\|
(?'called'\\d+)
\\|
(?'spent'[.,]\\d+|\\d+(?:[.,]\\d+)?)
\\|
(?'percent'\\d{2,3}(?:[.,]\\d{2})?)%
$
Also thanks to his profile, I see that the percentages are not being calculated correctly so I’ll fix that too.
The percentages problem came back to how the values were being read. It now has custom code to figure out the decimal point being used and convert the value properly, then display it properly. You can now open locally or internationally-created profiles in the same session and they will be read and displayed in the way you’d expect.
Changes have been pushed to the repo. Thanks again Dirk.