Hi there. When I use the “profile code” flag, where can I see the results? I remember times ago it was in the left sidebar…
Thanks a lot.
Hi, Sergio!
When the program Quits, a new pane will pop up in the center with a corresponding entry in the navigator. Note that ending the debug run via the IDE will not generate profile session results.
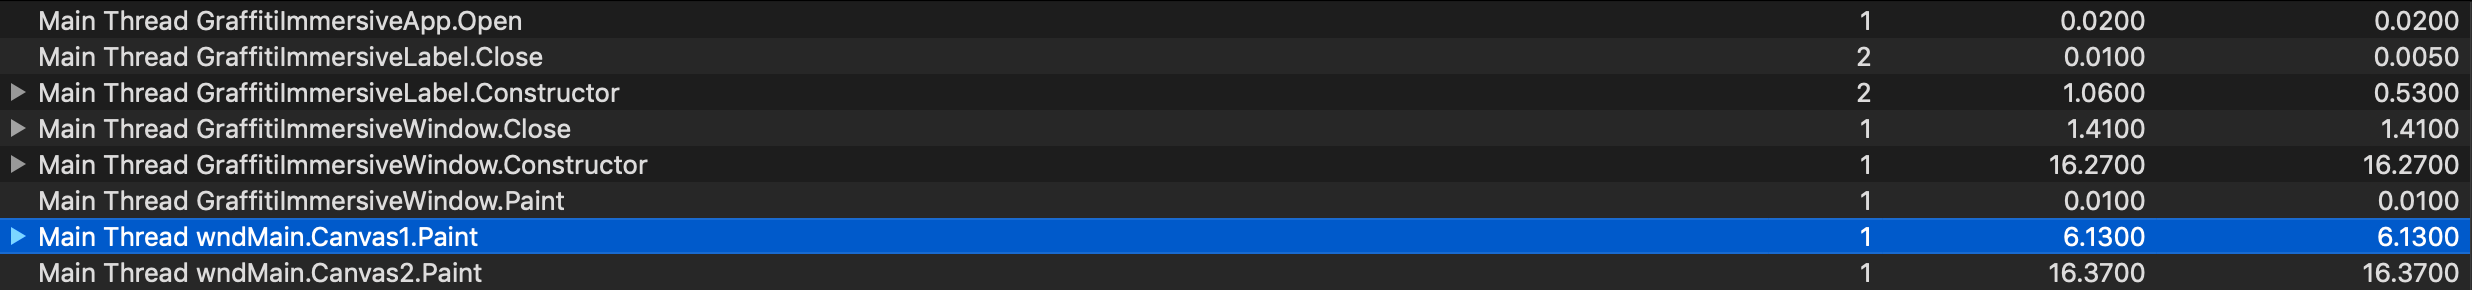
The center pane, showing results:
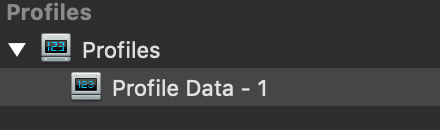
The results listed in the left-hand Navigator pane:
See this page of the documentation for more information about the Code Profiler.
Is what I remember… But in the last version 2019r3.2 I can’t find that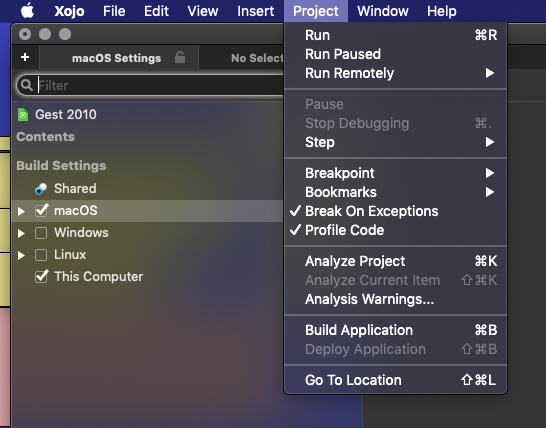
You have Profile Code checked. Now run your project, perform an action, and then cause your app being debugged to Quit without stopping the debug session via the IDE. The results will be in the center pane, and have a corresponding entry in the left-hand navigator.
More information here:
https://documentation.xojo.com/getting_started/debugging/code_profiler.html
1 Like
By the looks of your screenshot it’s possibly because you’re in a tab that has a limited view, try changing tabs to one that shows the whole project. I’m not at my pc so I can’t double check.
Typically, the IDE should bring up the report regardless. That’s been my experience. If it doesn’t that seems like it would be a bug that needs to be reported. I did some more testing, and the IDE has consistently brought up the report regardless of the current tab’s contents. Can you confirm?
1 Like
I cannot get profiling to show up no matter what I do.
I have tried in Xojo 2015, 2018, 2019 (2 releases)
Profile code is ticked.
No terminate command is used, and the same happens if I comment out all QUIT commands
1 Like
Have you tried on a brand new project?
Do you even see the Profiles entry appear in the left nav after running with Project>Profile Code ticked on?
You have to run your app from the IDE. Also it has to quit normally, do not press stop. So you need at least one Quit command.
You have to run your app from the IDE.
Naturally.
Also it has to quit normally, do not press stop.
Done, using either Window close or the Quit menu of the debug app.
So you need at least one Quit command
Tried with and without.
Nothing.
Yes.
One window, one button, a loop
Nothing
Profiles entry never shows up.
I think I last saw one in 2015
Do you have access to a VM or another machine, have you tried it in windows? If so, do you see the Profile Code entry there?
It’s possible that the Xojo preferences are broken. You could quit Xojo, move the preferences folder to your desktop and launch Xojo again, forcing it to create a new preferences folder, then make sure Profile Code is ticked and try again.
works on Windows Xojo 2015 in a vm, using same code.
Deleted prefs on Mac (lost all prefs obviously - straight into launch screen/ agree to send debug stuff to Xojo , IDE font was different)
, ran using 2018 r3 still nothing.
Hey since we’re talking about VMs, dumb question and friendly reminder:
You’re not trying to profile code with Remote Debugger are you? You can only profile code locally.
hahaha.
No.
Nice and simple, Xojo for Mac 2018 or 2019
On a Mac
Using a Basic project or complex one
cleared caches
Profiling only works for me using Xojo WIndows inside a VM running Windows 7, Xojo for Win 2015, on code local to the windows IDE*
I dont actually know how to remote debug.
(*which doesnt help a lot as its a mac-specific slowdown Im trying to investigate)
Xojo has full disc access
Deleting the preferences doesn’t work because the file is cached. Either you need to log out and back in or you use PrefsEditor from Thomas Tempelmann to nuke the values with a cmd-a + delete.
Remove debugging is explained in some guide. Once it’s working you won’t go back to testing on hardware.
Thought it WAS testing on hardware. Remotely. ![]()
Was logged out when I deleted the prefs, and they were very clearly gone.
For what it’s worth, I pretty much gave up on using Xojo’s profiler - I find Apple’s Instruments’s Time Profiler tool much easier to use:
Also, the Xojo Profiler did not deal well with Threads - the time counts aren’t correct.
<https://xojo.com/issue/10072> Although there was a later change in Xojo2013r1 <https://xojo.com/issue/26267> so maybe it works better now?