Many of my users are reporting an app crash after repeatedly doing a particular thing in my app. Some users have to do it 100 times in order for the app to crash and, for other users, the crash occurs after 150 or 200 times. I suspect that I have a memory leak.
This thing that my users do occurs in a View. The View is repeatedly instantiated and PushTo’d in the usual way. The View has an Event Definition and, when I instantiate it in the calling View, I use AddHandler to point the Event Definition in the called View to a method in the calling View so that the calling View can handle the saving of data. In the View’s close event I invoke the Event Definition.
I have three questions that I think would help me to work through this issue:
If a View has an Event Definition called in its Close event, which means that the View itself is passed back to the handling method, do you need to expressly close the View in the calling View? The View seems to close by itself but maybe this is causing an issue?
I don’t believe we can use Instruments with Xojo and yet I’ve seen comments on this forum such as “this is consuming 1Mb each time and not releasing it”. How can I see how much memory my app is consuming as it executes so that I can check and verify that it is being released?
The crash seems to occur if you do this thing in the View quickly, which is how most users do it. It’s as though whatever is auto-releasing memory doesn’t have time to catch up. Is there a way to force the system to catch up on its reference counting/auto-releasing?
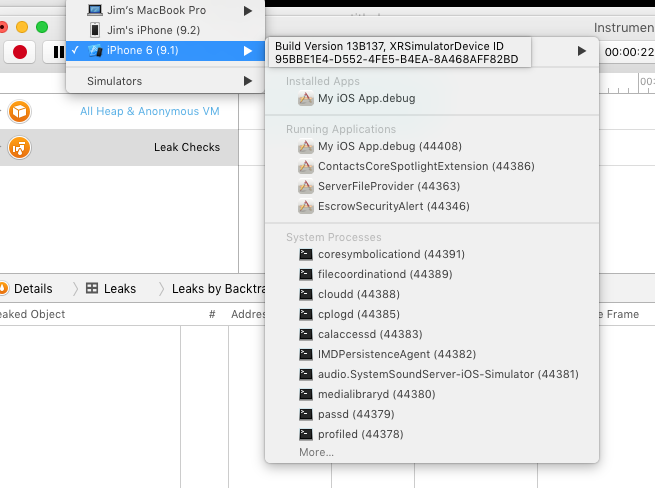
Just launch your app, then in instruments select the running app from the process popup. Something like myMac->myApp.app. Or myiPhone->myApp.app
Sometimes you have scroll down to find it. Keep in mind that you’ll need to manually delete the debug app as instruments will prevent xojo from deleting it after the run is complete.
To the other question. Be sure to Always balance addhandler with removehandler. Otherwise things don’t get released. I’m guessing that’s where you’re running into issues. I’m not even sure you would find something like that via instruments though.
Thanks Jim. When I run my app in the iOS Simulator it doesn’t appear in Instruments. The iOS Simulator does though, but not my app. Or do you mean I should run it on my device while it is connected to the computer?
With regard to balancing AddHandler with RemoveHandler, that’s a great tip that I somehow missed in the docs. I had thought that by passing a WeakAddressOf into AddHandler that I didn’t need to then call RemoveHandler. But if I have to call RemoveHandler, where is the usual place to do this? In the method that receives the method call, for example?
Oh yeah. I think you need to run it on the device. Been a little while since I used it for iOS.
I generally call removehandler in the close event or an objects destructor. Just be sure there is no way it’ll get called twice for the matching addhandler or you’ll get an exception (runtime?)
OK I can see how to do that. My app seems to have several thousand leaks doing nothing (i.e. just running it and not tapping anything). I guess I need to look into how Instruments works.
I have a View called ReportView. It has a method called ShowArea which instantiates a new instance of a View called AreaView and does a PushTo to show it.
AreaView has an event definition called SaveArea. In the Close event of AreaView I check a local property, mChanged, and if it’s true I call the SaveArea event definition.
Back in ReportView, before it does a PushTo on the AreaView instance, it does an AddHandler and sets the AreaView instance’s SaveArea event definition to the WeakAddressOf a method in ReportView called SaveArea.
So…I’m not sure where to do the RemoveHandler. I can do it in ReportView.SaveArea but that may not be called by AreaView.Close if mChanged = false.
Be sure you have the “Leak checks” row selected and not the “All Heap & Anonymous VM” row.
Thousands of allocations is normal (the top row).
If there are leaked objects, you can see the stack by clicking the “E” icon in the pane in the right side of the window (next to the squiggle and gear icons. You’ll need to have the “Gather Leaked Memory Contents” checked in the display settings (the Gear icon) to see the stack. This will tell you where the object was allocated and hopefully give you enough to track it down.
It means that the handler shouldn’t prevent the destruction of the attached objects, but you’ll need more exception handling because they could be not there when you call them.
If, on the other hand, these methods are only called once, just add the RemoveHandler right to the target method.
It looks like there is a UIView that’s not getting released. Most likely the other objects are owned by that view. You might try building the app and adding it to a real iPhone via XCode’s devices window. Then you can launch it from instruments and see a stack trace on each object by selecting the object and then selecting the “E” button (Extended detail). That should help you narrow down what isn’t being released and hopefully find the issue.
Does instruments allocation tool work for your debug builds? It always stops simulator for me once I try to activate it. Leaks works, but it only helps me in one out of ten cases. More often I encounter memory leaks only visible in Activity Monitor and which I couldnt debug yet.
Addition: @Jason: In case you use iOSLib in that project: Locate the global libdebug property and set it to true. Object creations and releases will be written to console, together with their ARC count. Sometimes this helps finding releases where the ARC is higher than 1 which usually shouldnt be the case for self-created objects.