Recently (~ since Xojo 2025 3.1), I have been occasionally seeing the spinning beachball that can last ~ 20 to 60 seconds. This might occur every couple of hours during a coding session. I change something in the code or move a control in a window, and suddenly the spinning beachball appears. I worry that there has been a crash, but ultimately it resolves.
In years past, this never occurred. Have others seen this? Is it Tahoe? Is it me? Is it recent versions of Xojo?
In my current session, it has occurred three times in less than 15 minutes of coding. I have saved the application. I have Built the application. Doesn’t seem to change things.
Recently I moved from using .xojo_binary_project as my project file format to .xojo_project, but this was occurring while I was still using .xojo_binary_project.
Thanks for the link to the feedback issue. Comforted that it is occurring to others. Sad that Xojo cannot confirm. I have not figured out any particular way to make it happen. The changes that I am making to my code are generally trivial; it is not as if I am pasting in many lines of code or something of that ilk.
A fair question is whether the machine has adequate resources, as RAM hungry as Xojo is. I’ve not really seen this issue, but I could see a large project thrashing the swap file.
The problem is that switching the front most window from Xojo to anything else (either by CMD+Tab or clicking a different window) corrects the behavior. I tried this when I first saw the problem and it’s just not possible.
Good call. This looks like it’ll work via the Shortcuts app.
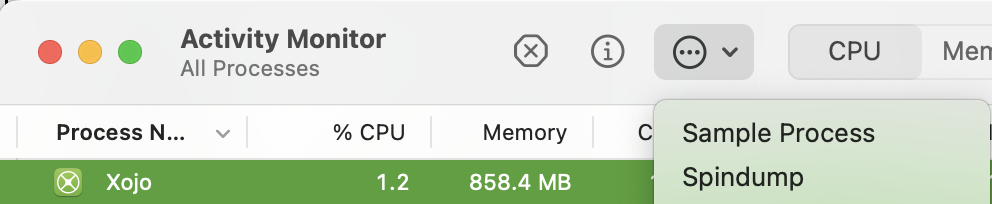
I suppose there’s a good chance that the keyboard shortcut won’t work while the frontmost app is unresponsive, but it’s worth a shot.
#!/bin/bash

APP_NAME="Xojo"
DURATION=5
OUTFILE="$HOME/Desktop/xojo_sample_$(date +%Y%m%d_%H%M%S).txt"

PID=$(ps aux | grep "/$APP_NAME.app/Contents/MacOS/$APP_NAME" | grep -v grep | awk '{print $2}' | head -n 1)

if [ -z "$PID" ]; then
  echo "Xojo main process not found"
  exit 1
fi

sample "$PID" "$DURATION" -file "$OUTFILE"
I managed to catch a sample when the beachball showed up while trying to expand a row in the source list. It appears to be recursive paint calls. Which would explain why deactivating the window “fixes” it, since the paint calls would stop.
This sample isn’t “hung” in the traditional sense (deadlock or waiting on a lock). It’s actually spinning the UI thread in a pathological repaint/layout loop.
What the sample shows
Everything is happening on the main thread inside the event loop :
NSApplication run → nextEventMatchingMask → normal UI loop
But instead of idling, it’s constantly executing paint/layout code:
SourceList.SourceCanvas_Paint
SourceListSupport.SourceListRow.Event_Paint
Graphics.DrawString / DrawPicture
The real problem
Inside that paint cycle, there’s deep recursive layout computation:
I’m currently working on a project where a dictionary has about 300 entries. It takes super long to show the values in the IDE. I’ll make a ticket later today.
I will add that I am seeing this on 3.1 with Mac M3Max 128gb Tahoe. See it on very small projects. i posted another discussion as I had not seen this one. But this definitely exists and it is very regular.

 The hang is caused by a runaway repaint + layout recursion loop on the main thread , not a deadlock.