Hi there! I’m getting lots of low memory errors with my app. So I decided to try Apple Instruments to see where the problem might be. The first problem is: I don’t understand Apple Instruments
I connected my iPhone to the MacBook and started Apple Instruments, selecting “Allocations”. Then I started my app. So my question is: the column “Persistent” shows the memory that’s being allocated to the app, right? So that’s the one I need to bring down. Is this correct? I have attached a screenshot.
If so, I don’t understand these two things:
“Persistent” values are going up while the app is open although the app does nothing. I am just looking at the app and don’t touch it but the memory is going up slowly. What does that mean? Is there something running in the background?
When I open a view showing a few iOS Table Cells with images on it, the memory goes up. As expected I guess. When I close the view I had assumed that the images are being released from the memory automatically and I don’t have to worry about them any longer. That doesn’t seem to be the case because the memory never goes down (regardless of what I do). How do I handle these things? Do I need to kill every image ever shown from memory when I close a view?
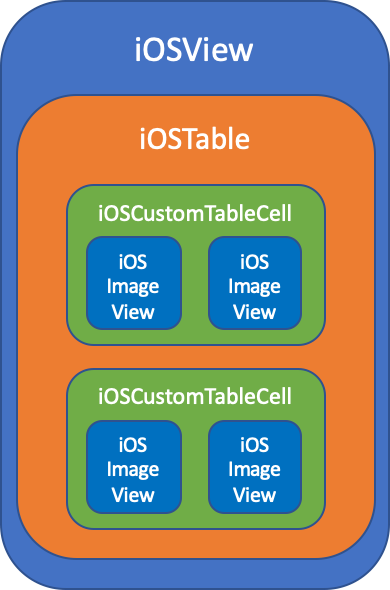
That’s a good point, thank you. I believe I still have instances of these pictures open but I don’t know how to remove/release them. This is how the view looks like (I’m still calling it iOSView because the project has not been converted to API2.0 yet):
iOSView → iOSTable → multiple instances of the same iOSCustomTableCell with multiple iOSImageViews controls on it.
When I close this view I would assume all the controls on it are being released from memory. The problem might be the iOSCustomTableCell because it’s “global”. Is there a way to make the iOSCustomTableCells “local” so that they will get deconstructed when closing the view? Or do I have to remove each instance of the iOSCustomTableCell one-by-one? I tried removing the iOSTable but that won’t change the memory allocation.
Still, if there are no tables on the view, the view and its content is still being kept in memory when I close it. So if I have 4 pictures 1 MB each on a view, 4 MB of memory will be added to the app’s memory usage every time I open the view. I would expect those 4 MB being released from memory when I close the view but that doesn’t happen.
How do you see that the memory isn’t released? Did you check the count of the objects in Xojo? There is also a difference between the total memory and the used memory.
There are three reasons which lead me to believe the memory isn’t being released:
In Instruments, when I select the “Activity Monitor”, the value in column “Memory” for my app increases every time I open the view and doesn’t decrease when I close it.
Same for the column “Persistent” under “Allocations” in Instruments (see screenshot in my first post). The two values from the “Activity Monitor” and “Allocations” are identical.
I can force a LowMemory warning when I open and close the view often enough. I am not doing anything else in the app and it takes quite some “open and close” of the view but eventually the LowMemory warning will come up.