I write a lot of messages to System.DebugLog to help me debug code. I’m looking for a way to see the messages to find where my compiled code is bogging down. The documentation says it’s writing the message to the Console on the Mac, but I don’t know how to view the console. I’ve opened the Console app, but I can’t find the messages I’m writing.
1 Like
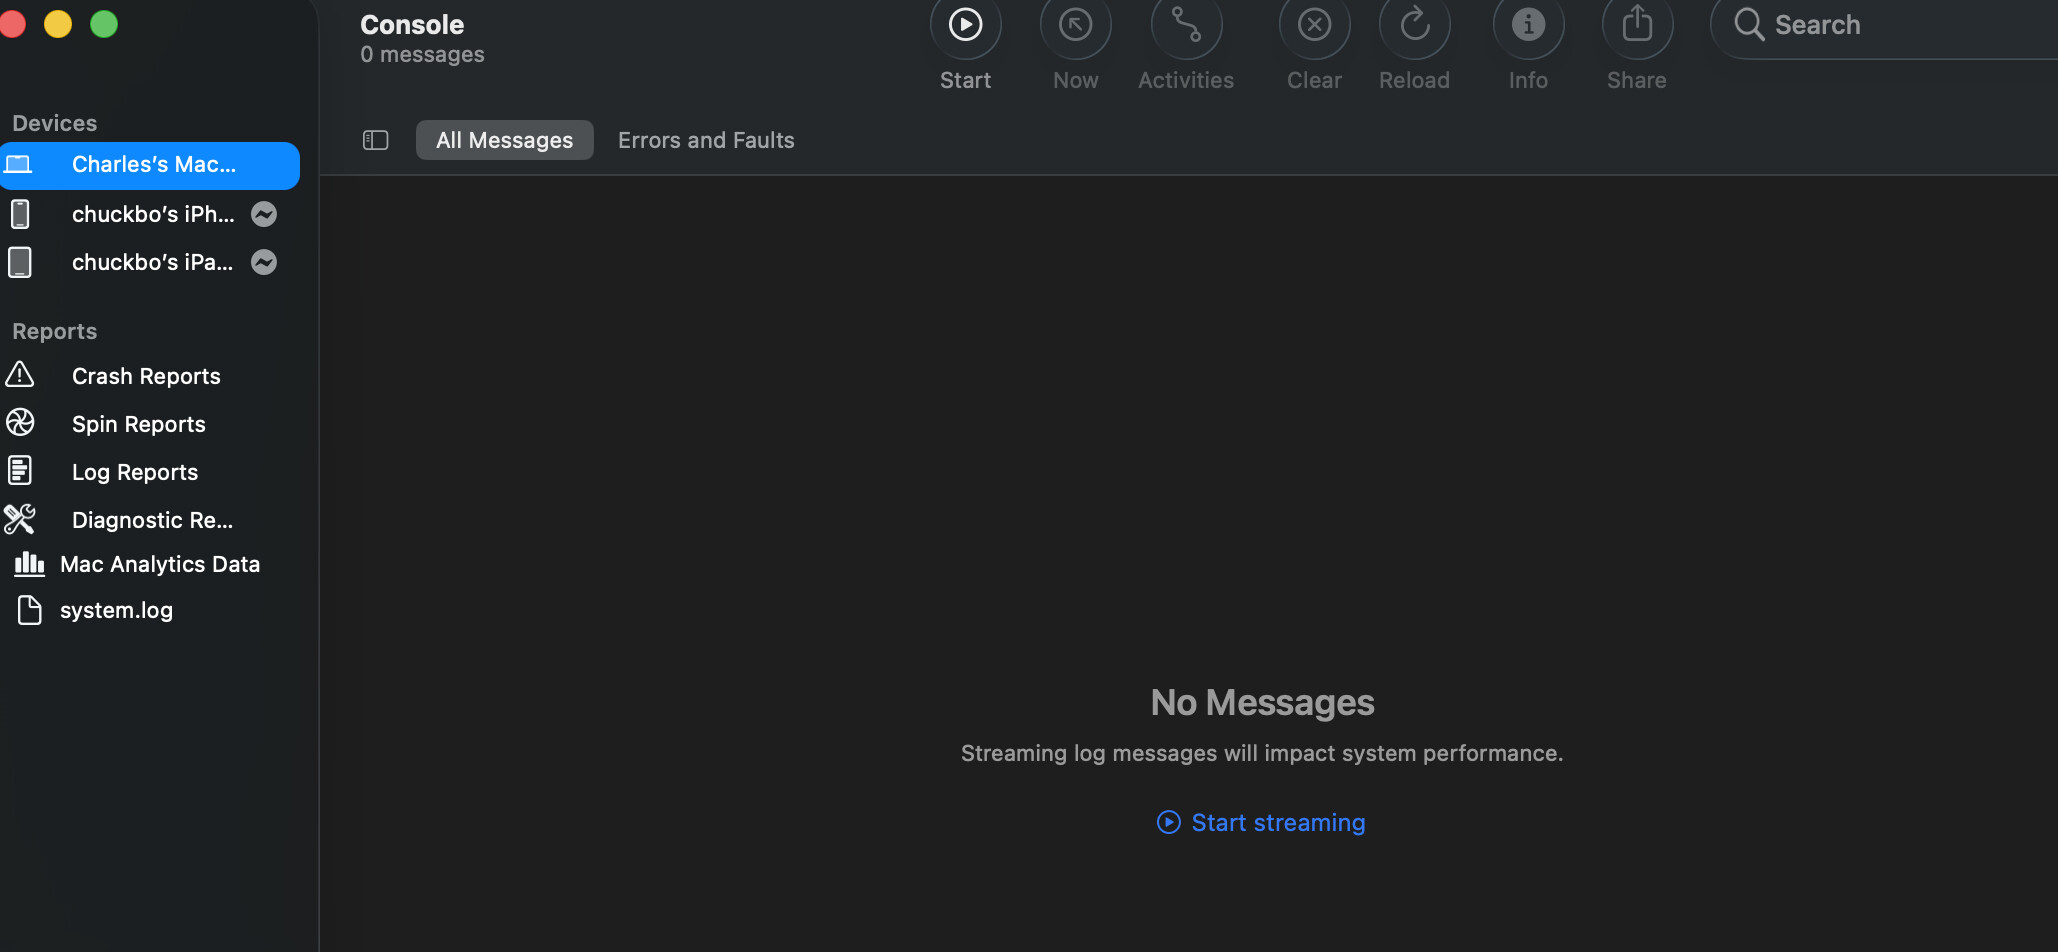
Enter the name of your app, click start, wait some time, click on stop.

It’s easier to see the DebugLog messages if you prefix them.
To analyse speed a better method is to use profiling in Xojo or Instruments.
I’m sorry; I’m confused.
- I was running the app tonight and it was sending messages to the console. But when I select my laptop and All Messages, the main panel is empty.
- I don’t know what profiling or Instruments are. I didn’t find anything about Instruments in the documentation that looked pertinent. I found entries for Stopping and Starting profiling but it didn’t provide any explanation on what it does or how to use it.
- You need to click on the Start button. Alternatively you can use an app like BackLog ( Using BackLog to get information from the Console ) to read information from the Console.
- The documentation on the built-in profiler looks very thin. I found an older YouTube video which contains more information: https://www.youtube.com/watch?v=khFeFLSbPNA .Instruments is part of Xcode. I have an older series on Instruments on my blog ( Blog: News and Tutorials about Mail Archiver ).
Personally the way I do this is I have a method called Log that checks #if DebugBuild and then either does System.DebugLog or appends to a text file if the machine name is my dev box.
You know there’s a profiler for looking at this, right?
3 Likes