So I have a simple chart that shows the run-times and days for my generators. ( I live off-grid so I track generator run time, solar production and daily energy use ). The chart works fine but what I want to do is be able to click on a datapoint and have it run a query to populate fields. I can get part of the data I want but not the other part and I haven’t been able to figure out how.
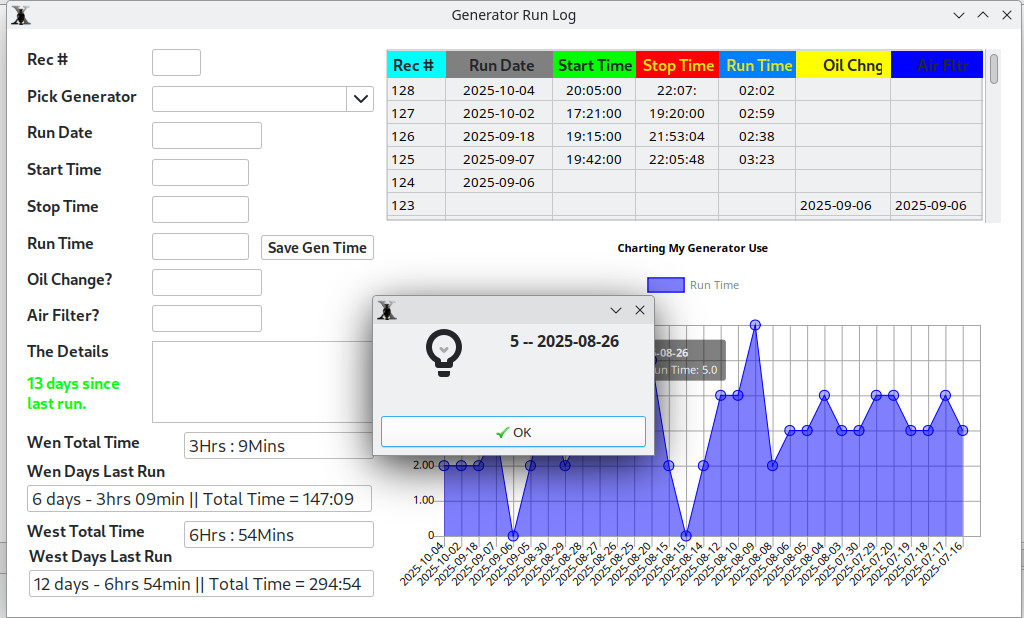
I will embed two images that show what I see and hope that helps explain my goal. This first image is a mouse over a datapoint and what is displayed.
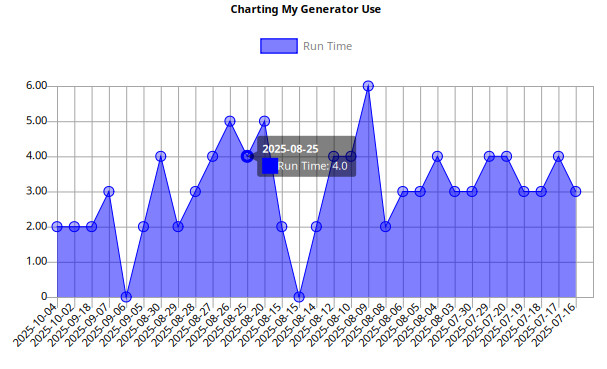
As you can see I have the date ( which is what I need for the query to work… ) and the run time.
What I have been able to do so far is get the run time when I click on the datapoint, see the image below.
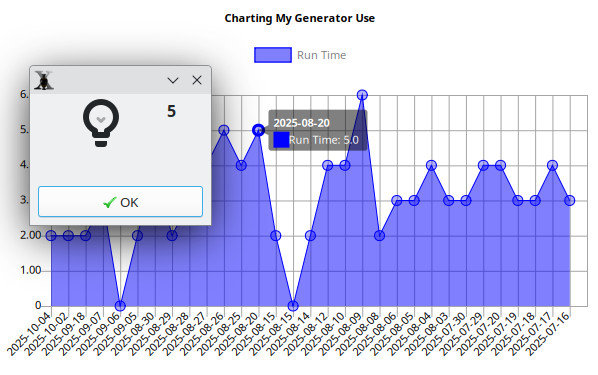
I need the date too, but I don’t know how to get it. So below is the code for loading my chart.
' ---- Variable Defined ----
Var rsData As RowSet = modSel.mthGeneralSelect( "tblGenerator", "DESC" )
Var chtOne( ), chtTwo( ), chtThr( ), chtFor( ) As Double
Var cHold As Currency
Var sLbls( ), sHold, sMonths( ), sCost( ), sComp As String
Var iCalc, iCount, i As Integer

' ---- Code In Action ----
chtGenRuns.RemoveAllDatasets
chtGenRuns.RemoveAllLabels

Try
  If( rsData <> Nil ) Then // So long as there is a record return it then close the rowset...
    For Each row As DatabaseRow In rsData
      sHold = rsData.Column( "rDate" ).StringValue.Left( 4 )
      sComp = modSystem.mthDate.Left( 4 )
      If( sHold = sComp ) Then
        chtOne.Add rsData.Column( "runTime" ).DoubleValue
        sLbls.Add rsData.Column( "rDate" ).StringValue
        i = i + 1
      End If

      If( i = 31 )Then

        chtGenRuns.mode = DesktopChart.Modes.Line
        chtGenRuns.Title = "Charting My Generator Use"
        chtGenRuns.AddLabels sLbls

        Var DS1 As New ChartLinearDataset( "Run Time", Color.Blue, True, chtOne )
        DS1.ChartType = ChartLinearDataset.ChartTypes.Line

        chtGenRuns.AddDatasets DS1', DS2, DS3

        rsData.Close
        Exit Sub
      End If
    Next
  Else
    MessageBox( "What, no records?!" )
  End If

Catch error As DatabaseException
  MessageBox( "Error: " + error.Message )
End Try
And here is the code for when I click on a datapoint, this is located in Chart.Pressed
' ---- Variable Defined ----

' ---- Code In Action ----
If( Dataset IsA ChartLinearDataset ) Then
  MessageBox( ChartLinearDataset( Dataset ).RowAt( index ).ToString )
End If
So how do I get the date as well?