Identifying crash on Windows symbols

Hello,

Trying to figure out a crash happening on Windows only using WinDbg Preview to inspect mini dump.

For that I try to add to the Default symbol path the path of the symbols generated by Xojo right after the build but I always get Wrong symbols

EXCEPTION_STR:  WRONG_SYMBOLS
PROCESS_NAME:  ntdll.wrong.symbols.dll
IMAGE_NAME:  ntdll.wrong.symbols.dll
MODULE_NAME: ntdll_wrong_symbols

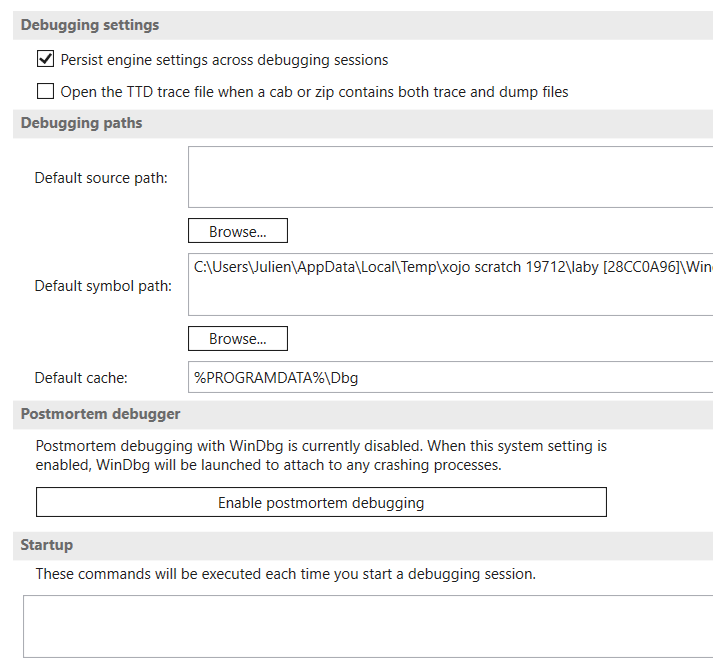
I use .sympath command to add it or through the settings interface
C:\Users\Julien\AppData\Local\Temp\xojo scratch 34436\laby [28CC0A96]\Windows_x86_64

I got all .o / .bc files and the .pdb file in the path above.

I also tried to add the srv* to the sympath, this solve the current issue but the debugger point outthe module XojoGUIFramework64 but can not pinpoint the method causing the crash.

I got

XojoGUIFramework64!DesktopApplication_SetUserDarkModeSupport+0x2556
FAILURE_BUCKET_ID:  INVALID_POINTER_READ_c0000005_XojoGUIFramework64.dll!Unknown

If you have any idea or direction where to look for.

Windows 11
Xojo 2022r2

Thank you

Maybe this blog post would be helpful? I don’t do much hard debugging on Windows these days, so the link is all I can really offer.

Thank you,

I did follow this blog post already and the result was the same. I tried to compile with different xojo version also to see if I could get more data compiling with other versions…

1 Like

Do you see the trash when running in the IDE ?

When running in debugging mode, the app crash and got nothing on the IDE

Did you check “break on exception” ?

It reads like a crash within the framework, I’m not sure this is an exception.

XojoGUIFramework64!DesktopApplication_SetUserDarkModeSupport+0x2556
FAILURE_BUCKET_ID:  INVALID_POINTER_READ_c0000005_XojoGUIFramework64.dll!Unknown

I’d be most specifically curious about DesktopApplication_SetUserDarkModeSupport

https://documentation.xojo.com/topics/debugging/what_to_do_when_your_app_is_consistently_crashing.html

I already did that. I am quite used now to using it (I thought so) but every dump returns nearly the same error with nothing more.

I checked that but nothing for the moment, I will check again.

I do not know what this method is too. I tried to remove the Dark mode support too but it’s always this method that came up in the dump.

Are you running the app under dark mode ?

No I am always in light mode (normal mode) and never switch

Errors that are displayed are either:

NULL_CLASS_PTR_READ_NULL_POINTER_READ_c0000005_XojoGUIFramework64.dll!Unknown
or
INVALID_POINTER_READ_c0000005_XojoGUIFramework64.dll!Unknown

Could this help ?

@Michel_Bujardet Thank you, I will check that

Could not find something finding the issue with all the steps described in the link.

When does the crash occur ? At launch, or later ?

If during run, the use of breaks in the IDE could perhaps help narrowing down where the crash actually occurs.

Crash occurs when closing or opening a specific window that contains a lot of containers inside a pagepanel.

Using breaks running in the IDE you should be able to pinpoint where the crash occurs.

When a window instantiates, first each control Opening event fires, then when all controls have instantiated, then the Opening event occurs for the window.

You may put a break in the window Opening event, and see if the code actually stops there. In that case it would mean the crash occurs later. Going step by step with the arrows should help you narrow it to the crash.

If the crash occurs before the window Opening event, perhaps you can place a break in the PagePanel Opening. Going step by step should enable you to pinpoint the crash location.

I will try that and do step by step

Since you have no other way to know where the bug is, tracing the code is the only way that remains.

I have done it on occasion. It is a bit slow and could be boring, but you should be able to get to the root of it.