I posted a while ago about my web apps on Xojo Cloud were showing 80%+ memory usage. I found that after deleting several test apps and restarting the server brought the server memory down to ~15%
I periodically check the server memory usage, and it has been creeping up there, around 60%. When I see this, I restart the server, and the memory drops back down
I was checking out the docs and found AutoQuit. Would this be a worthwhile add to my web apps? Setting App.AutoQuit = True in the App.Opening?
If I am reading the doc correctly, once all users have ended their sessions and no one currently is on the app, it will quit, freeing up memory that might be held up, which would relieve me from needing to manually restart the server. It is common for my users to all be out of all my web apps during the middle of the night. Then come morning, when the first user connects to the app, this “restarts” the server. Is this an accurate assumption?
Some of my users don’t “log out” of the app and might just close the tab/browser. Does this still count as their session ending?
Xojo cloud is running Linux, right? There have been discussions before in which I report that my Web Apps running on macOS don’t seem to have any memory leaks, where others on Linux are reporting issues.
I wonder if you could try out your web app on another platform (macOS, Windows…) and see if you notice a different memory usage behavior?
Log when a session opens and closes. Your sessions may be kept open.
In the Xojo helpfile under WeakRef - See Circular References
Circular references
The most common use is to prevent a circular reference, that is, an object that holds a second object where the second object also holds the first object. With a circular reference, you can lose access to an object that will never be destroyed, creating a memory leak.
The most common scenario here is the parent/child relationship. Let’s say you create a Tree class that can hold many Leaf classes in an array. From any Leaf, you want to be able to get back to its Tree. That is, the Tree is the parent and the many Leafs are its children.
I have checked my app numerous times and I’m quite sure there are no circular references.
However, each opened/closed session will build up approximately 24kio of memory for my app.
Depending on the amount of daily users you have, your server will run out of memory sooner or later.
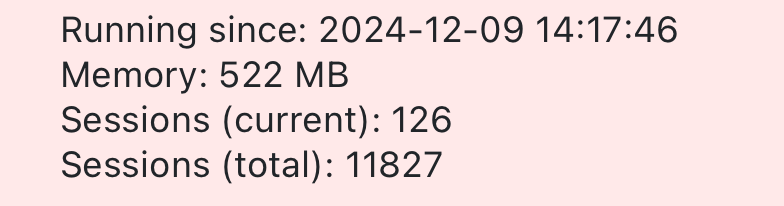
I measured the average memory footprint of an active session in my app to be less than 2MB.
126 open sessions should only be using 250MB + 20-30MB for the “core” of the app. When the app restarts with only one session open, it uses 20-30MB.
I tried App.AutoQuit = True and the app was randomly restarting even though there were still some active sessions. But it might be some error in my code.
If your app is only used at specific times, 8AM to 8PM for example, you could schedule a restart in the middle of the night.
In my case I can’t, because there are 200+ active sessions at any time of the day/night.
@Ryan_Hartz
I’ll post a xojo project tomorrow that helps finding memory leaks. It’s a simple WebPage you just need to add to your app.
I think the original code for ObjectStatusItem was written by @Kem_Tekinay but not sure. If someone else deserves the credit, please correct me.
The setup is fairly simple.
First run the Web MemoryReport project to get instructions.
Try out the memory report from that project to familiarise yourself with the classes and objects that the Xojo Web Framework loads in memory for all running WebApps.
Especially the massive amount of _VariantString.
After adding the memory report page/features to your app, run the memory report a first time as soon as your app deploys on the server.
Come back to the memory report page a few hours later and run the memory report again.
Compare object growth to active session count and analyse the data.
Good to know, thanks. If it isn’t relevant any longer, I wonder why it is still available
Thanks so much for sharing this! I will implement it into my apps and start to monitor
I wish it were that simple. I occasionally will check my login logs in the morning to see any usage. Quite often the last login is late at night, but there are some late-nighters who still access in the wee hours. The app is only used by US users, but with the sporadic very early morning logins, unfortunately, I don’t have an ideal time of day to do a restart. Hence why I was hopeful for the App.AutoQuit as an option for the app to see there are no current users and restart itself. I just had a thought though. I could do a scheduled restart and then have the app message any users an hour ahead of time saying “hey, the app is going to restart at XX:XX. You should prepare to log out before that.” I’ll first monitor the usage over some time and then maybe implement a scheduled restart
Lifeboat can schedule your app to restart, but you are unfortunately at the whim of when the cron.[hourly/daily/weekly/monthly] scripts run and aren’t able to select a specific time.
Yikes, that is brutal. I’m working on a web app now that makes dozens if not hundreds of URLConnections per session. Hope Xojo is able to get to the bottom of it.
Edit: After thinking about it, for now it should be easy enough to pivot to use curlsmbs instead. Probably a good idea until this is resolved.
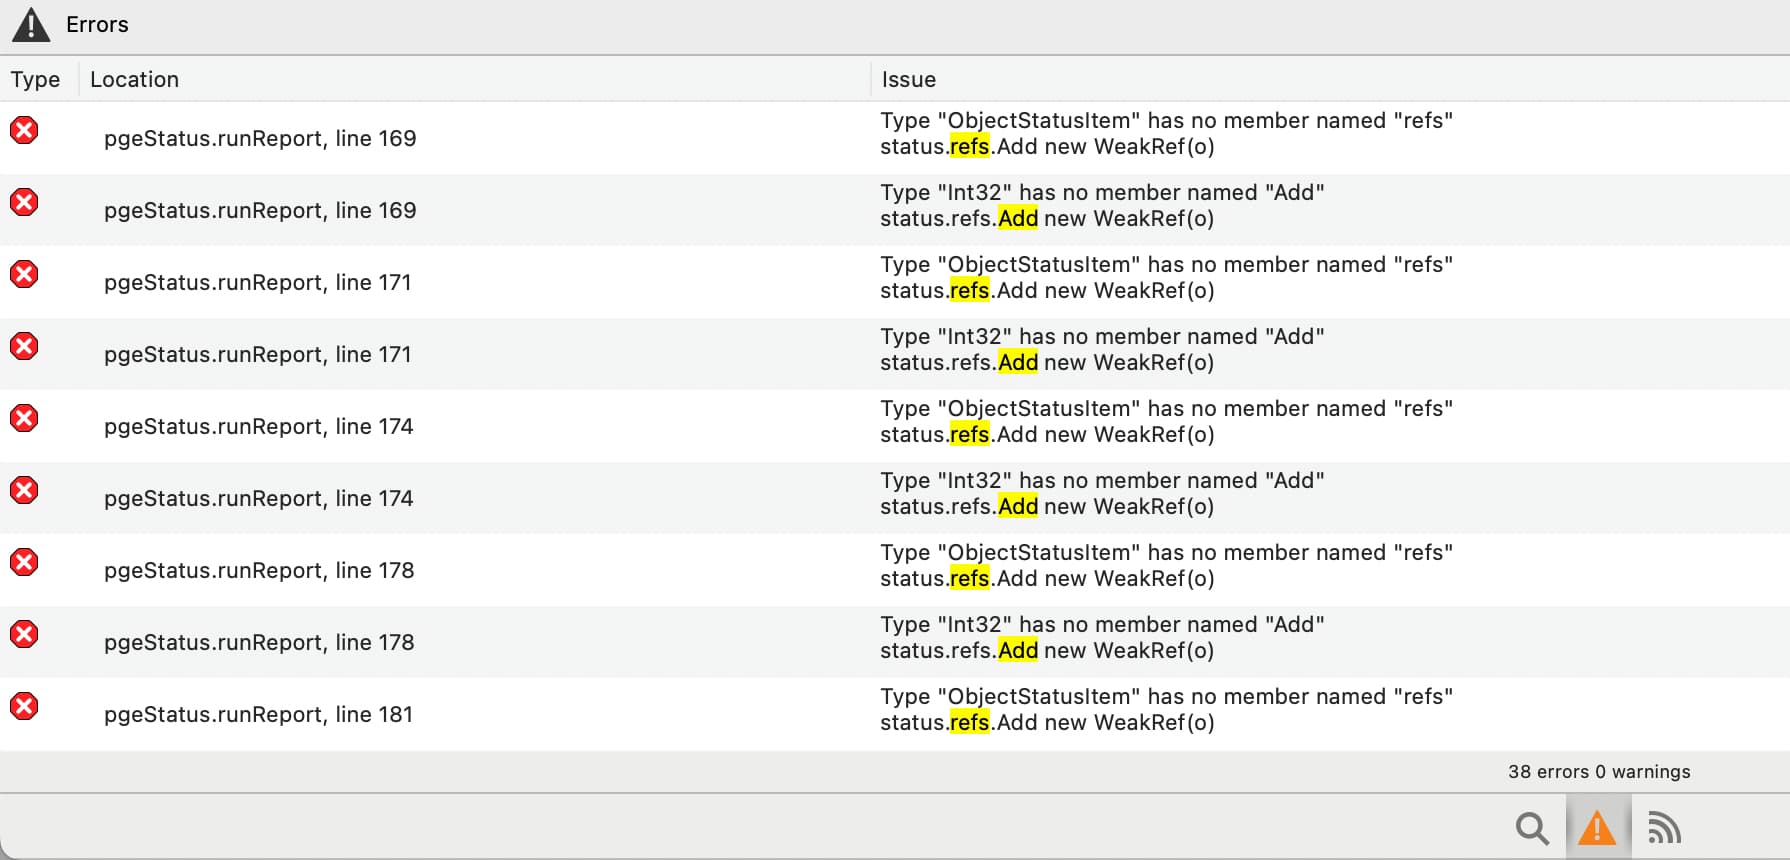
Hi @Jeremie_L. Your memory report works very well in debug mode. I went to build the project and come up with several errors. Looks like the errors have an issue with the .refs pieces. Found in:
pgeStatus.runReport
pgeStatus.DisplayReport
pgeStatusDetail.LoadTable
pgeStatusDetail.UpdatePagination
Is it safe to just comment these out? I even just tried building your memory project, and the same
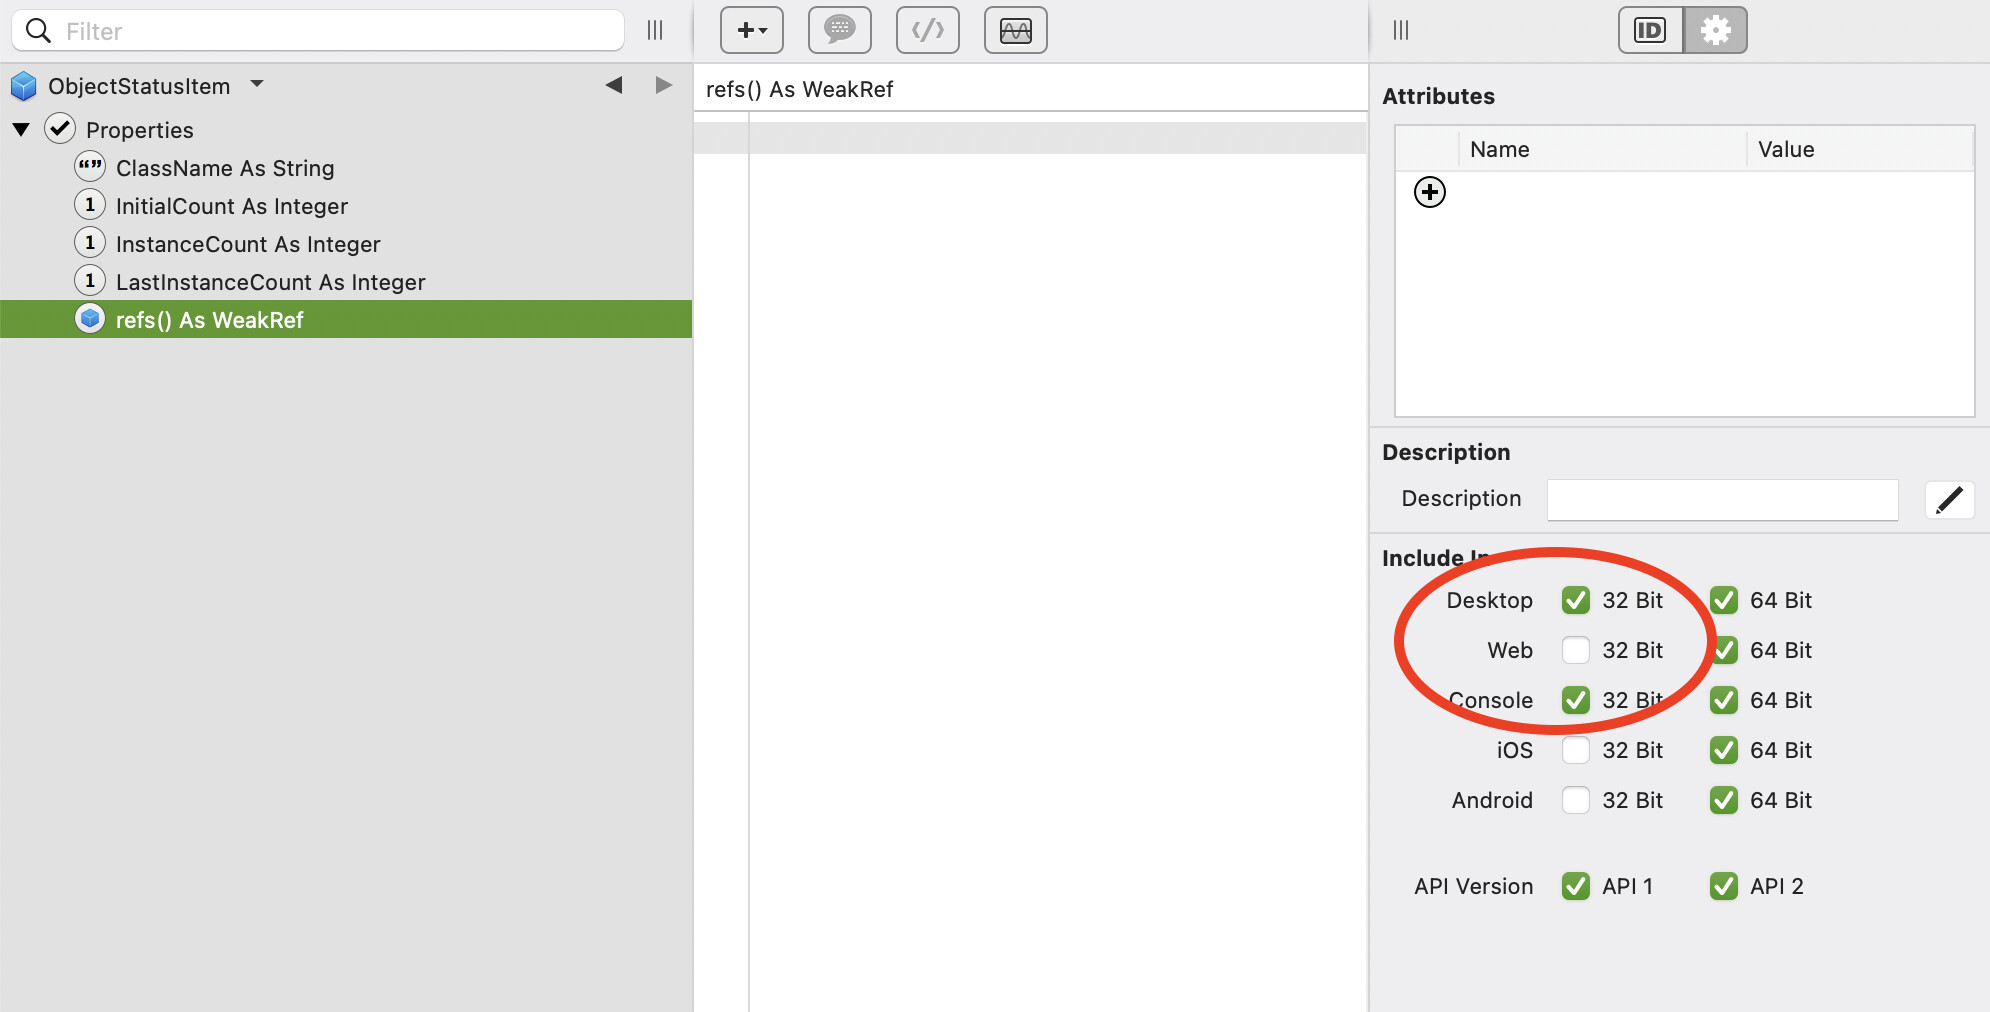
I think the refs property is disabled in the advanced tab of the inspector for Linux 32 bits. Make sure it is activated (checkbox) and you will be able to build.
I’ll post a screenshot as soon as possible.
Yes. You could just comment those out, but they can be useful when investigating memory leaks for dictionaries, string and integer arrays.