With a Xojo stand alone running on linux the mem usage is typically very low at 2-20Mb. However, lately I have noticed some of our apps consuming huge amounts of RAM. Even a dead simple app that basically has a handle url and nothing else is climbing to over 600mb over the course of a week. This has been observed with 2019r3 and 2020r2.1.
Any Ideas? At the moment I am just restarting the apps nightly but that is not ideal.
This same happens with an empty project (web2.0) where some url would be called like http://mydomain.com/test (multiple times)
In app handleurl there is nothing to handle this nor is a webpage or session called ever. It still leaks memory this way. Meaning that it’s probably internally before App.HandleURL and not user code, since none was added.
I’m seeing this too, but in my case it seems that something changed between 2020R1.2 and the latest release. The version built with 2020R1.2 would run for weeks and not increase RAM usage, whereas the version built with 2021 R2.1 has used 800+MB after about 24 hours.
I suspect the same, i’ve noticed this too and reported a case for it.
It could be that the memory is growing with the sockets and the sockets never being released or xojo could explain why there is so much memory staying in use so long?
In Web apps there is no way to set and get the MinimumAvailableSockets and MaximumAvailableSockets for the webserver at runtime making it even harder to check if this is the cause.
Xojo should be investigating such issue in all levels. logging things, dumping memory, creating debug versions of Xojo and c libs involved, etc, etc. In a week the culprit would be found and fixed. Limiting sockets is not the problem, the problem is requesting resources and not releasing them at some point.
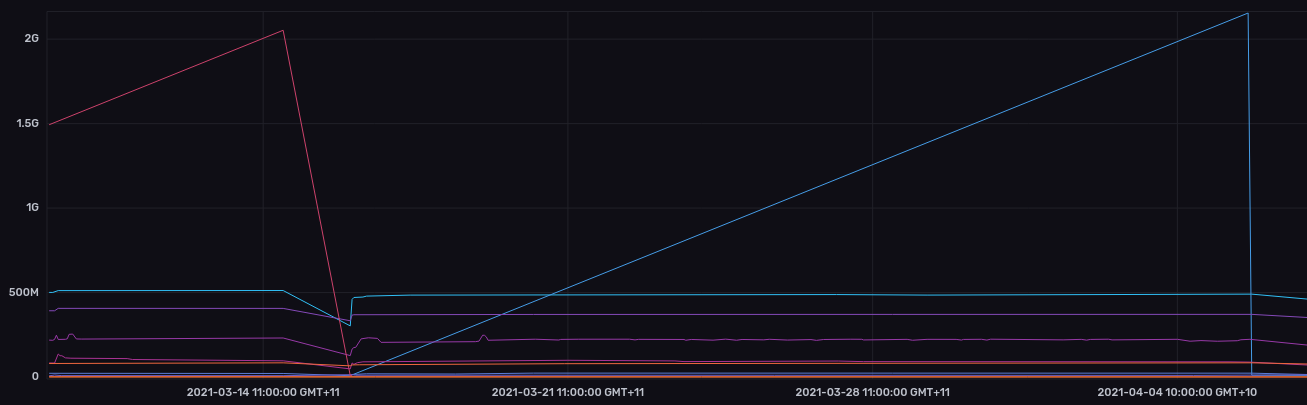
 That’s running 2019r3.2