How to draw Fan Chart?

Hi everyone,

i would like to draw a Fan Chart as you can see on a Canvas. So the Data Structure “Person” with 2 Properties: Name As Text, Father As Person and Mother As Person. How to realize such a drawing? Any strategies?

[code]const Pi = 3.14159265358979323846264338327950

Dim a As ArcShape

a = New ArcShape
a.Width = 600
a.Height = 600
a.FillColor = &cFFFFFF
a.BorderColor = &c000000
a.BorderWidth = 1
a.Border = 100
a.ArcAngle = conPi * 45 / 180
a.StartAngle = conPi * -180 / 180

g.DrawObject(a, 400, 400)

a = New ArcShape
a.Width = 400
a.Height = 400
a.ArcAngle = 1.57
a.StartAngle = -1.57
a.FillColor = &cFFFFFF
a.BorderColor = &c000000
a.BorderWidth = 1
a.Border = 100
g.DrawObject(a, 400, 400)

a = New ArcShape
a.Width = 400
a.Height = 400
a.FillColor = &cFFFFFF
a.BorderColor = &c000000
a.BorderWidth = 1
a.Border = 100
a.ArcAngle = conPi * 90 / 180
a.StartAngle = conPi * -180 / 180

g.DrawObject(a, 400, 400)

a = New ArcShape
a.Width = 200
a.Height = 200
a.FillColor = &cFFFFFF
a.BorderColor = &c000000
a.BorderWidth = 1
a.Border = 100
a.ArcAngle = conPi * 180 / 180
a.StartAngle = conPi * -180 / 180

g.DrawObject(a, 400, 400)
[/code]

This has http://documentation.xojo.com/index.php/Object2D written all over it.

Thanks Michel, i know. But i mean the algorithm. How to Draw the lines between the sections? Because by using ArcShape i don’t know the coordinates from the shape…

You might have to do some really fancy math.

Those lines have endpoints on 2 circles, different radii but same angle.

To calculate the <x, y> coordinates of a point on a circle of radius R at angle A (measured in radians)…

x = R * Cos(A)
y = R * Sin(A)

hmmm, I don’t know what you don’t know to know what to explain. Maybe this will help

[code]Sub Paint(g As Graphics, areas() As REALbasic.Rect) Handles Paint
g.ForeColor = &cFFFFFF //fill white and draw the rest in black
g.FillRect 0, 0, g.Width, g.Height
g.ForeColor = &c000000

dim fullRadius As double //figure how big the biggest ring can be
if g.Height * 2 < g.Width then
fullRadius = g.Height
else
fullRadius = g.Width / 2
end

dim cx, cy As integer //coordinates of circle center
cx = g.Width / 2
cy = g.Height

dim ringCount As integer = 5

dim r As double //draw each ring
for i As integer = 1 to ringCount
r = fullRadius * i / ringCount //radius as a percentage of full radius
g.DrawOval cx-r, cy-r, r+r, r+r
next

// draw line segments between rings
dim x1, y1, x2, y2 As integer, r1, r2, a As double
dim lineCount As integer

for i As integer = 1 to ringCount - 1

lineCount = 2 ^ i                        //lines emanating from inner ring
r1 = fullRadius * i / ringCount          //radius of inner ring
r2 = fullRadius * (i+1) / ringCount      //radius of outer ring

for j As integer = 1 to lineCount - 1    //draw each line
  a = 3.14159 * j / lineCount            //angle of this line between the rings
  x1 = r1 * Cos(a)                       //calc coordinates of segment
  y1 = r1 * Sin(a)
  x2 = r2 * Cos(a)
  y2 = r2 * Sin(a)
  g.DrawLine cx + x1, cy - y1, cx + x2, cy - y2     //plot
next

next

End Sub[/code]

Note in plotting, positive Y is down so the y coordinates are subtracted from the center, while X is normal so it’s just added.

Will beat me to it, but this is how I did it:

Sub Fanchart(g As Graphics, size As Integer,depth As Integer)
  dim x1,y1,x2,y2,radiusEnd,radiusStart,radiusInitial,radiusIncr As Integer
  dim xOrigin,yOrigin,i,j,k As Integer
  dim angle As Double
  dim arc As new ArcShape
  Const pi=3.14159265359
  'Adjust the origin to suit. These determine the centre of the semicircle
  ' as measured from the bottom left side of the canvas.
  xOrigin=g.width\\2
  yOrigin=10
  arc.ArcAngle = pi
  arc.StartAngle = -pi
  arc.Fill=0
  arc.Border=100
  arc.BorderWidth=1
  arc.Segments=100
  radiusIncr=size/depth
  radiusInitial=radiusIncr*1.5
  g.ForeColor=&c000000
  g.PenHeight=1
  g.PenWidth=1
  'Draw inner arc
  arc.Height=radiusInitial*2
  arc.Width=radiusInitial*2
  g.DrawObject(arc, xOrigin,g.height-yOrigin)
  'Draw base line
  g.DrawLine(xorigin-radiusInitial-depth*radiusIncr,g.height-yOrigin,xorigin+radiusInitial+depth*radiusIncr,g.height-yOrigin)
 'Draw remaining arcs and radial lines
 for i=1 to depth
    radiusStart = radiusInitial+(i-1)*radiusIncr
    radiusEnd = radiusInitial+i*radiusIncr
    arc.Height=radiusEnd*2
    arc.Width=radiusEnd*2
    g.DrawObject(arc, xOrigin,g.height-yOrigin)
    k=2^i
    for j = 1 to k-1
      angle=pi*j/k
      x1=radiusStart*cos(angle)+xOrigin
      y1=radiusStart*sin(angle)+yOrigin
      x2=radiusEnd*cos(angle)+xOrigin
      y2=radiusEnd*sin(angle)+yOrigin
      g.DrawLine(x1,g.height-y1,x2,g.height-y2)
    next
  next
End Sub

Yeah, this is one of those times when high school is actually useful! Lol!

Thanks Will and Robert. Looks simple. So this just draws the circle segments. And how to add the text and generations into the Cells?

Well, I was expecting some questions so you could start figuring this out yourself. Here’s a routine using StringShape for rotated text but if this were to be mac only I’d use declares for the transform. I can write your code for a small fee if you’d rather :slight_smile:

[code] dim textSize As double = fullRadius / ringCount / 3.5
for i As integer = 0 to ringCount - 1

lineCount = 2 ^ i                       
r1 = fullRadius * (i+0.5) / ringCount - textSize/2 

for j As integer = 0 to lineCount - 1
  
  a = 3.14159 * (j+0.5) / lineCount 
  x1 = cx + r1 * Cos(a)
  y1 = cy - r1 * Sin(a)
  
  dim ss As new StringShape
  ss.Text = Str(i)+","+Str(j)
  ss.TextSize = textSize
  ss.Rotation = 1.5707 - a
  ss.X = x1
  ss.Y = y1
  ss.Border = 0
  ss.Fill = 100
  ss.FillColor = &c000000
  
  g.DrawObject ss
  
next

next[/code]

Positioning straight rotated text is complicated enough as it is. However, note that the original example uses curved text which would require even more effort. Since I’m in the middle of a project that requires precise positioning of rotated text, it was easy enough to produce the following:

The revised fanchart program is as follows:

 Sub Fanchart(g As Graphics, size As Integer,depth As Integer)
  'Input parameters:
  ' Depth - number of concentric rings not counting the inner one
  ' Size - the radius of the overall chart
  dim x1,y1,x2,y2,radiusStart,radiusInitial,radiusIncr As Integer
  dim xOrigin,yOrigin,i,j,k,txtRot As Integer
  dim angle,InnerRatio As Double
  dim arc As new ArcShape
  dim txtPic As Picture
  dim name,dob,dod As string
  Const pi=3.14159265358979
  g.ForeColor=&c000000
  g.PenHeight=1
  g.PenWidth=1
  'Adjust the origin to suit. These determine the centre of the semicircle
  ' as measured from the bottom left side of the canvas.
  xOrigin=g.width\\2
  yOrigin=10
  arc.ArcAngle = pi
  arc.StartAngle = -pi
  arc.Fill=0
  arc.Border=100
  InnerRatio=0.8 'Allows radius of inner semicircle to be different than the others
  radiusIncr=size/(depth+InnerRatio)
  radiusInitial=radiusIncr*InnerRatio
  'Draw outer arc
  arc.Height=size*2
  arc.Width=size*2
  g.DrawObject(arc, xOrigin,g.height-yOrigin)
  'Draw base line
  g.DrawLine(xorigin-radiusInitial-depth*radiusIncr,g.height-yOrigin,_
  xorigin+radiusInitial+depth*radiusIncr,g.height-yOrigin)
  
  dim NodeNumber As Integer = 1
  dim vertTxtIncr As double = 0.8
  'Node 0 text
  angle=pi/2
  name="First Middle Last "+str(NodeNumber)
  dob="Date of Birth "+str(NodeNumber)
  dod="Date of Death "+str(NodeNumber)
  DrawRotText(g,xOrigin,yOrigin,NodeNumber,name,dob,_
          dod,0.8*radiusInitial,0.15*radiusIncr,angle,size*0.02)
  
  'Draw remaining arcs radials and text
  for i=1 to depth
    radiusStart = radiusInitial+(i-1)*radiusIncr
    'radiusEnd = radiusInitial+i*radiusIncr
    arc.Height=radiusStart*2
    arc.Width=radiusStart*2
    g.DrawObject(arc, xOrigin,g.height-yOrigin)
    k=2^i
    'Draw radial lines
    for j = 1 to k-1 step 2
      angle=pi*j/k
      x1=radiusStart*cos(angle)+xOrigin
      y1=radiusStart*sin(angle)+yOrigin
      x2=size*cos(angle)+xOrigin
      y2=size*sin(angle)+yOrigin
      g.DrawLine(x1,g.height-y1,x2,g.height-y2)
    next
    'Draw text
    for j=k-1 downto 0
      NodeNumber=NodeNumber+1
      angle=pi*(j+0.5)/(k)
      name="First Middle Last "+str(NodeNumber)
      dob="Date of Birth "+str(NodeNumber)
      dod="Date of Death "+str(NodeNumber)
      DrawRotText(g,xOrigin,yOrigin,NodeNumber,name,dob,dod,_
          radiusStart+0.9*radiusIncr,0.15*radiusIncr,angle,size*0.02)
    next
  next
End Sub


Sub DrawRotText(g As Graphics,xOrigin as integer,_
          yOrigin as integer, node As Integer,name As String,dob As String,_
          dod As String,radialDistance As Double,radialIncrement As Double,_
          angle As Double,fontsize As Double)
     'Draws rotated text at the given radial distance and angle from origin
     'You'll have to write this part yourself...
End Sub

My DrawRotText() subroutine is part of a larger piece of software, but you can use the info in Will’s last post to write your own.

Nice subtle catch!

Notice the wiggles in the ArcShape drawing though, one of the reasons I avoid Object2D unless necessary.

Yes, and it seems to be especially bad on HiDPI monitors. Xojo really needs to work on this.

Drawing it into a larger picture and then scaling it back down for drawing on the canvas improves things considerably. This is a screen shot from the canvas:

Interestingly, there’s an optical illusion that makes the straight text appear to have a slight reverse curve.

For the examples that I posted previously, I was using a fairly bulky subroutine to rotate and position the text. It has far more bells and whistles than is needed here. I’ve now had a bit of time to pare things down to a more reasonable size and have created a subroutine for drawing the fan chart text. The main fan chart subroutine has also been slightly revised so that it takes the root person node (the person at the centre of the chart) as a parameter, and then traverses the family tree to get all of the text information to be displayed. For this I’m assuming that all of the family tree data already exists and the ‘person’ class contains the following properties:

class person
  Public Property Name as string
  Public Property Birth as date
  Public Property Marriage as date
  Public Property Death as date
  Public Property father as Person
  Public Property mother as Person
  Public Property Children() as Person
end class

The children() property is not necessary for this example, but would likely be required for a general family tree application to allow traversing the tree in both directions

This is the subroutine that draws the rotated text:

Public Sub DrawNodeText(g As Graphics,xOrigin as integer,yOrigin as integer, node As Integer, p As Person,radius As Double,radIncr As Double,angle As Double,fsize As Double)
  'Draws person's name and vital dates on fan chart
  ' as rotated text, at the given the origin, angle, 
  ' radius, and incremental radial distance between items.
  
  Const pi = 3.14159265358979
  
  dim x,y,i,w,h As Integer
  dim rad,txtRot As Double
  dim output() As string 
  dim s As new StringShape
  Dim pTest as new Picture(1,1)
  
  'Allow different text styles for each text item
  static txtClr() As Color = Array(&c000000,&c050580,&c000000,&c000000,&c000000)
  static textBold() As Boolean = Array(false,true,false,false,false)
  
  'Text is perpendicular to the radial angle
  txtRot=pi*0.5-angle
  
  'Text parameters
  s.TextFont = "Times"
  s.TextSize = fsize
  s.HorizontalAlignment = StringShape.Alignment.Left
  s.VerticalAlignment = StringShape.Alignment.Bottom
  s.Rotation = txtRot
  'Test picture pTest is used for measuring stringshape width and height
  ' using a method suggested by Alwyn Bester
  pTest.Graphics.TextFont = s.TextFont
  pTest.Graphics.TextSize = s.TextSize
  pTest.Graphics.TextUnit = s.TextUnit
  
  'Load text items into array
  output=array(str(node),p.Name,"b. "+p.Birth.ShortDate,"","")
  'Person may be alive and/or unmarried so check for nil dates
  if p.Marriage <> nil then output(3) = "m. "+p.Marriage.ShortDate
  if p.Death <> nil then output(4) = "d. "+p.Death.ShortDate
  
  'Draw the text
  for i = 0 to UBound(output)
    rad = radius-i*radIncr
    s.Bold = textBold(i)
    s.FillColor = txtClr(i)
    s.Text = output(i)
    pTest.Graphics.Bold = s.Bold
    'Get the half-width and half-height of the unrotated text
    w = pTest.Graphics.StringWidth(s.Text)/2
    h = pTest.Graphics.StringHeight(s.Text,10000)/2
    'Locate the text origin
    x = (rad-h)*cos(angle)+xOrigin-cos(txtRot)*w
    y = (rad-h)*sin(angle)+yOrigin+sin(txtRot)*w
    g.DrawObject(s,x,g.height-y)
  next
End Sub

And this is the revised original fanchart subroutine, along with subroutine AddToFam which retrieves the data from the family tree structure:

Public Sub Fanchart(gg As Graphics, size As Integer,depth As Integer, p As Person)
  'Input parameters:
  ' Depth - number of concentric rings not counting the inner one
  '   i.e.,  the depth of family tree to be displayed
  ' Size - the radius of the overall chart in pixels
  ' (Text size is automatically scaled to the chart size)
  dim x1,y1,x2,y2,radiusStart,radiusInitial,radiusIncr,pen As Integer
  dim xOrigin,yOrigin,i,j,k As Integer
  dim angle,InnerRatio As Double
  dim arc As new ArcShape
  Const pi=3.14159265358979
  'The following scaled up picture is used temporarily 
  ' to mitigate Object2D grainy resolution problems
  ' 4x may be a bit excessive, but it looks nice :-)
  dim scalePic As new Picture(gg.Width*4,gg.Height*4)
  dim g As Graphics = scalePic.graphics
  'Probably the most convenient way to get text from 
  ' family tree structure is to transfer it to an array.
  ' so that it is arranged in fan chart node order.
  dim family() As Person
  ReDim family(2^(depth+1)-1)
  'Fill out the array recursively starting with person 'p'
  ' the person at the centre of the fanchart
  AddToFam(p,1,family)
  'Graphics setup stuff
  pen=3
  g.ForeColor=&c000000
  g.PenHeight=pen
  g.PenWidth=pen
  'Adjust the origin to suit. These determine the centre of the semicircle
  ' as measured from the bottom left side of the canvas.
  xOrigin=g.width\\2
  yOrigin=50
  arc.ArcAngle = pi
  arc.StartAngle = -pi
  arc.Fill=0
  arc.Border=100
  arc.BorderWidth=pen
  arc.Segments=128
  InnerRatio=0.8 'Allows radius of inner semicircle to be different than the others
  radiusIncr=size/(depth+InnerRatio)
  radiusInitial=radiusIncr*InnerRatio
  'Draw outer arc
  arc.Height=size*2
  arc.Width=size*2
  g.DrawObject(arc, xOrigin,g.height-yOrigin)
  'Draw base line
  g.DrawLine(xorigin-radiusInitial-depth*radiusIncr,g.height-yOrigin,_
  xorigin+radiusInitial+depth*radiusIncr,g.height-yOrigin)
  dim NodeNumber As Integer = 1
  'Node 1 text
  angle=pi/2
  DrawNodeText(g,xOrigin,yOrigin,NodeNumber,family(NodeNumber),_
  0.9*radiusInitial,0.12*radiusIncr,angle,size*0.02)
  'Draw remaining arcs, radials, text
  for i=1 to depth
    radiusStart = radiusInitial+(i-1)*radiusIncr
    arc.Height=radiusStart*2
    arc.Width=radiusStart*2
    g.DrawObject(arc, xOrigin,g.height-yOrigin)
    k=2^i
    'Draw radial lines
    for j = 1 to k-1 step 2
      angle=pi*j/k
      x1=radiusStart*cos(angle)+xOrigin
      y1=radiusStart*sin(angle)+yOrigin
      x2=size*cos(angle)+xOrigin
      y2=size*sin(angle)+yOrigin
      g.DrawLine(x1,g.height-y1,x2,g.height-y2)
    next
    'Draw text
    for j=k-1 downto 0
      NodeNumber=NodeNumber+1
      angle=pi*(j+0.5)/(k)
      DrawNodeText(g,xOrigin,yOrigin,NodeNumber,family(NodeNumber),_
      radiusStart+0.9*radiusIncr,0.15*radiusIncr,angle,size*0.02)
    next
  next
  gg.DrawPicture(scalePic,0,0,gg.Width,gg.Height,0,0,g.Width,g.Height)
End Sub


Public Sub AddToFam(p As Person,index As Integer,fam() As person)
  'Recursively fills the family array for the fan chart
  if index>UBound(fam) then return
  fam(index)=p
  if p.father <> Nil then addToFam(p.father,index*2,fam)
  if p.Mother <> Nil then addToFam(p.mother,index*2+1,fam)
End Sub

Caveat: I’ve only tested this on a Mac (OSX 10.10.5). I don’t expect any platform specific issues, but you never know.
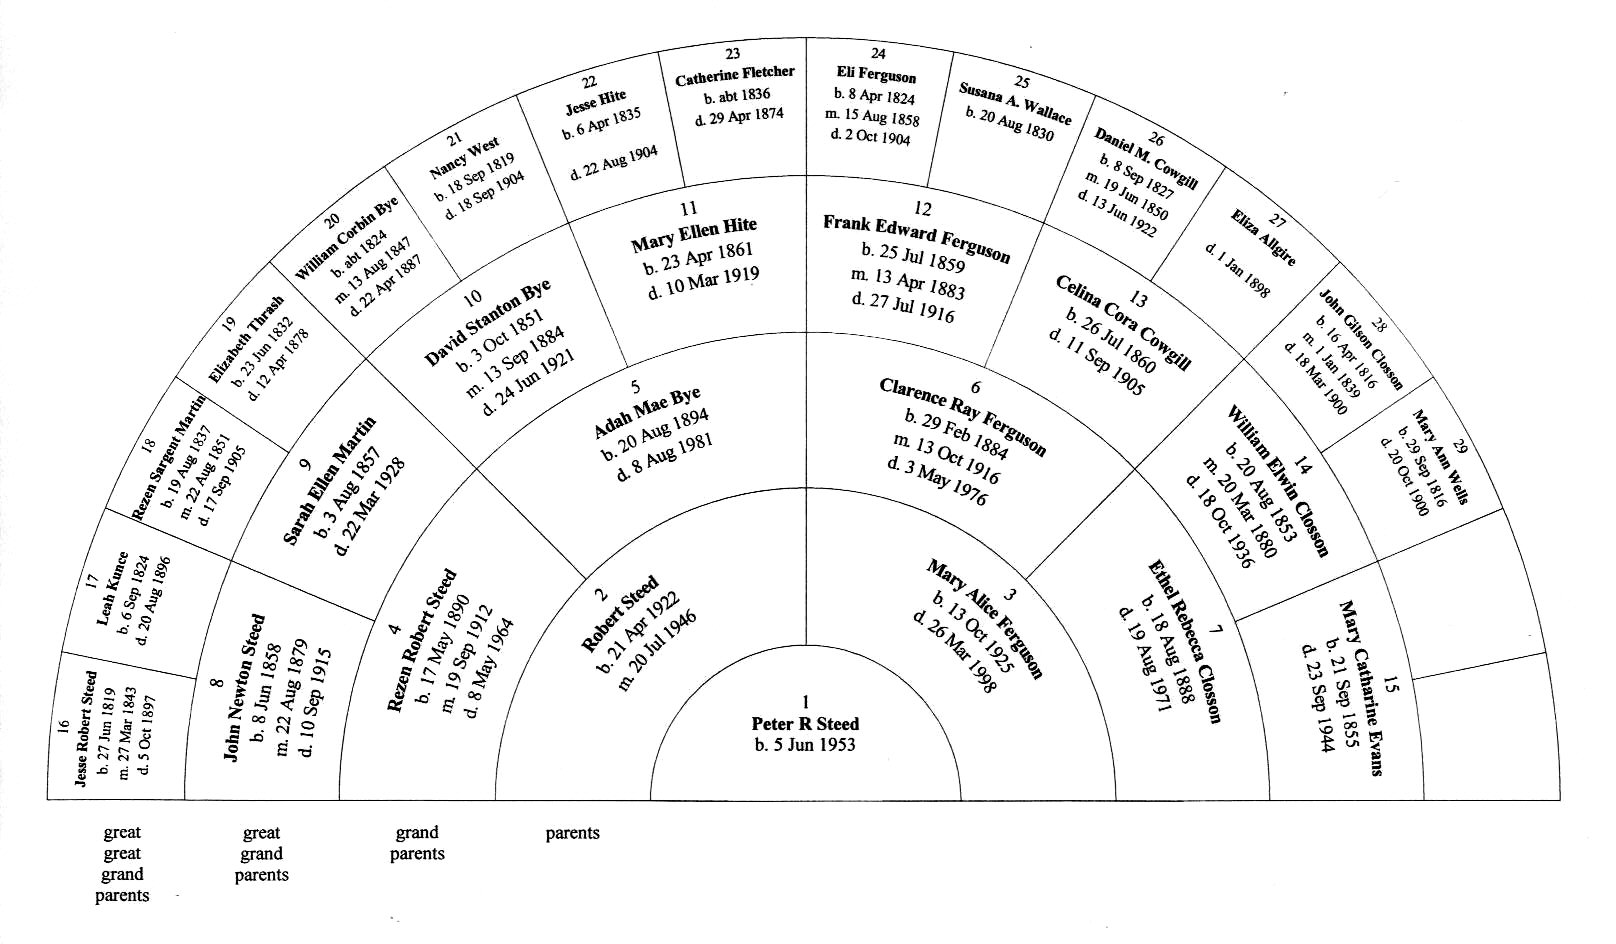
I forgot to mention, I made this method as part of the ‘person’ class to generate an example family tree for testing purposes.

Public Sub AddAncestors(level As Integer, depth As Integer, suffix As String,mm as date)
  'A recursive routine to generate a family tree for testing
  ' Tree level is specified by constant app.mylevel
  dim r As new Random
  dim db As new date
  dim dm As new date
  dim dd As new date
  dim today As new date
  dim baseyear As Integer = today.year-40
  'Marriage date is passed up from child node to make sure
  ' that both parents get the same wedding date
  if mm=nil then 'node 0 marriage date may be nil
    mm = new date
    mm.Year=mm.Year-10
  end if
  if mm<=today then marriage=mm
  'All other dates are randomly generated within reasonable ranges
  'Dates later than today are skipped and the value remains nil
  baseyear=baseyear-30*level 'generations are roughly 30 years apart
  db.year=r.InRange(baseyear,baseyear+8)
  db.month=r.InRange(1,12)
  db.day=r.InRange(1,27)
  if db<=today then Birth=db
  dd.year=r.InRange(baseyear+65,baseyear+95)
  dd.month=r.InRange(1,12)
  dd.day=r.InRange(1,27)
  if dd<=today then death=dd
  'if family tree has not reached target level, add more ancestors
  If level<depth then
    dim m as new person
    dim f As new person
    dm.year=r.InRange(db.year-2,db.year-10)
    dm.month=r.InRange(1,12)
    dm.day=r.InRange(1,27)
    Mother=m
    father=f
    'This creates unique but unimaginative names, such as "Father /F/M/F"
    ' which means "Father of Father of Mother of Father" which precisely
    ' describes the person's relationship to the root node. 
    m.Name="Mother "+suffix
    f.Name="Father "+suffix
    m.AddAncestors(level+1,depth,"/M"+suffix,dm)
    f.AddAncestors(level+1,depth,"/F"+suffix,dm)
  end if
End Sub

It can be called from the window open event with this code:

  firstPerson=new Person
  firstPerson.Name="The Person"
  treeDepth=4
  firstPerson.AddAncestors(0,treeDepth,"",nil)

I suppose you will save the image at one point.

The documentation (Xojo Documentation.pdf , page 666) gave code for Save (and Open, in page 667) shows how to save the vector image as the deprecated pict (on OS X) and I get a buggy result yesterday (and emf on Windows: I do not had time to check). When the image have no color, the pict have black instead.

In fact, saving it as png gaves me a correct result. I suggest you draw your Fan Chart far larger than needed and so save it on disk. You will get a better looking result when resized down.

To check what I wrote above, take the demo code from page 666, put it in a button, modify it to save your Canvas contents and save it.

HTH

Hello. I know this is an old post, but it fits my issue well. I am drawing a series of geometric shapes. I found this post, so thank you for the help on drawing a semi circle with spokes that I was able to adapt to my project.

I also need to accomplish the same thing with an eliptical shape with spokes as well.

What would be a code sample of how to calculate the radii of an ellipse so that the end point stops at the perimeter of the ellipse?

Thanks,
Rocky

The mathematics dealing with ellipses can quickly become very difficult. So, the simplest method would be to treat your ellipse as a circle, drawing it, and the spokes, into a picture object using the methods already given here, and then drawing that picture onto a canvas with different horizontal and vertical scale factors in order to get the desired aspect ratio.

The math behind an ellipse is exactly the same as for a circle, the only difference is you have TWO radii not one

x=(cos(angle)*radiusX)+cx
y=(sin(angle)*radiusY)+cy

x,y are the points on the edge of an ellipse, where cx,cy is the ellipse center point, radiusX is the Width/2 and radiusY is the height/2
angle is expressed in radians

i just used these equations (and others) to draw a custom “Poker Chip” graphic… that looks really good :slight_smile:

Simple ellipses may have simple math, but without knowing precisely what William wants to draw (a complete ellipse, or a partial ellipse? spokes radiating perpendicularly from an ellipse?), I prefer not to make any rash statements about how simple or difficult things may be. For example, try to calculate the length of an elliptical arc given the subtended angle? Or even more difficult, find the subtended angle when given the arc length. It’s easy when the shape is a circle, but not when it’s an ellipse. There may or may not be a simple formula, depending on what’s required.