If you ever want to see what the Xojo view classes do concerning layout, hidden items etc, you may be able to use Xcode’s View Debugger for that.
Here’s how it could look when you look at your Xojo app’s window:
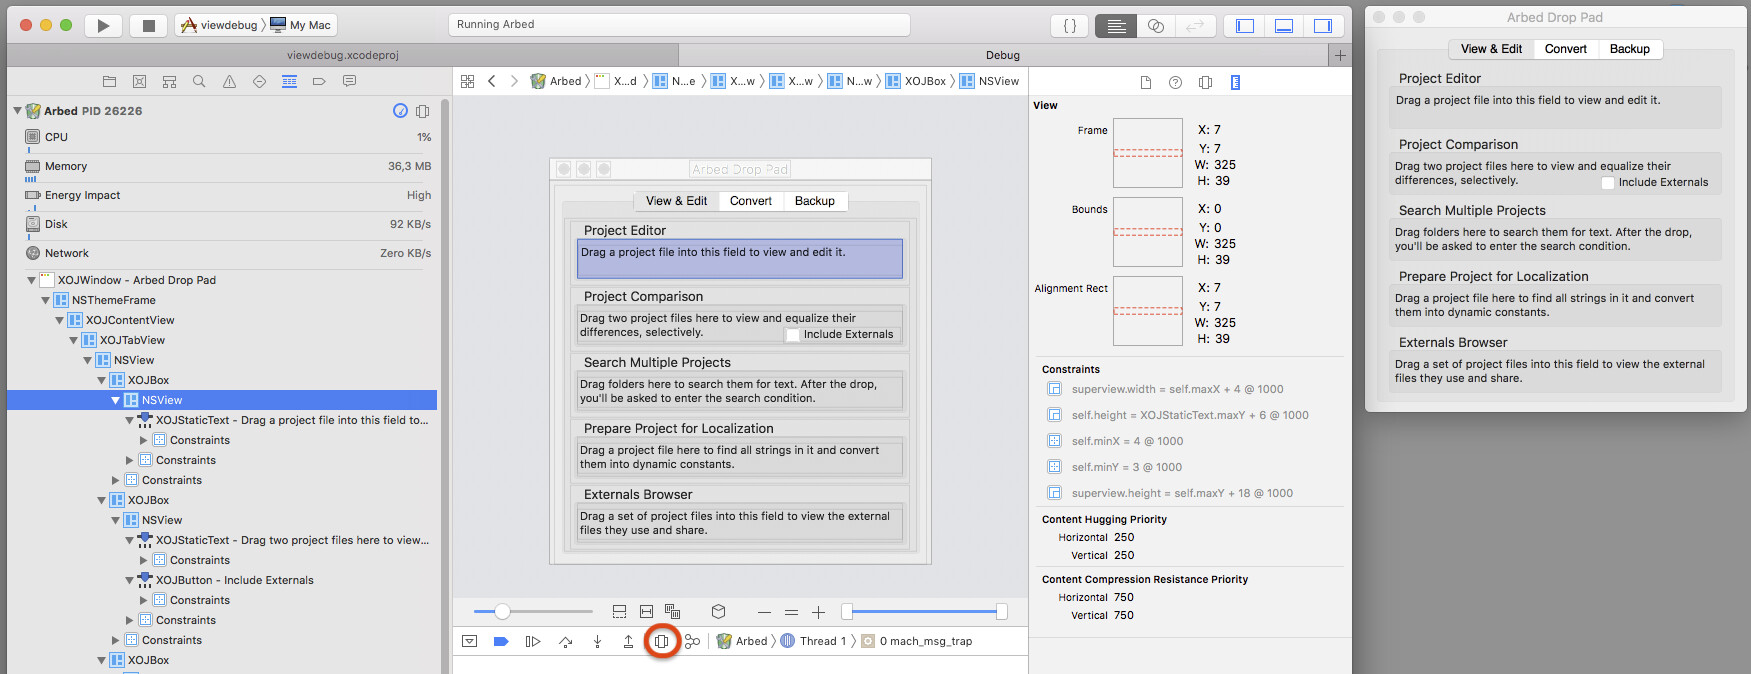
On the right you see my app’s main window, on the left Xcode’s debugger view outlining all the native Mac view components.
Note how, for each native NSView, there’s a Xojo subclass of it that helps Xojo to control it and handle the events, routing them to Xojo’s model.
To get to this, I did the following steps:
- I am on High Sierra
- I am using Xcode 10.1
- I create a new project in Xcode: “Cocoa App”, ObjC, and uncheck all options (e.g. no storyboard).
- I launch the Xojo app I want to explore.
- With the project open in Xcode, from the menu: Debug / Attach to Process, choosing my Xojo app.
- Wait a few seconds for Xcode to learn the app’s details.
- Click the “Debug View Hierarchy” button in the debugger view (circled in red on the image above).
May also work with newer macOS and Xcode versions, though I haven’t tried yet.