With this post I would like to ask a question about charts.
Now days, every business application contains a dashboard with charts and numbers but Xojo doesn’t contain any chart controls. How do you add charts to a desktop application window?


Thanks
With this post I would like to ask a question about charts.
Now days, every business application contains a dashboard with charts and numbers but Xojo doesn’t contain any chart controls. How do you add charts to a desktop application window?
Thanks
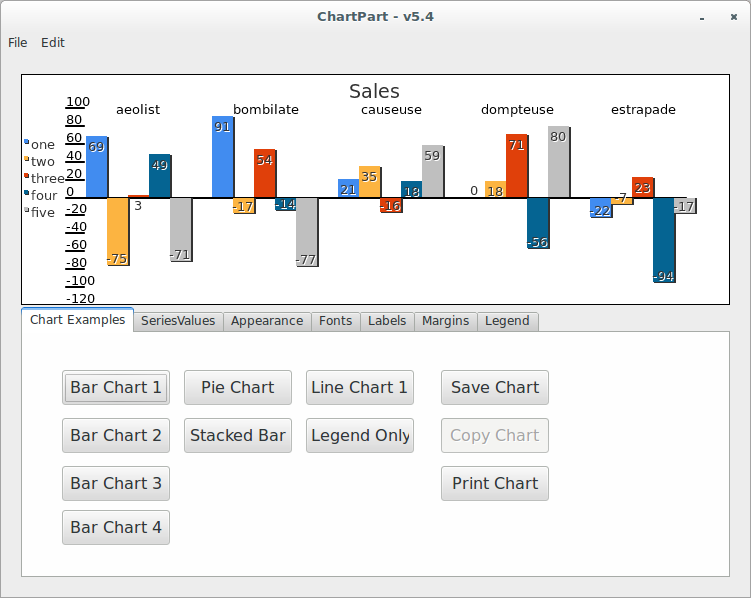
you can get one here :
http://cullytechnologies.com/products/chartpart/ctdownload.php
I wanted to create one for a project, then I realized that LibreOffice can do that by itself / why re-inver (poorly ?) the wheel ?
But you may NEED them.
MBS has a ChartDirector plugin.
https://www.monkeybreadsoftware.de/xojo/plugin-chartdirector.shtml
See our gallery here for the Charts we have:
https://www.monkeybreadsoftware.de/xojo/chartdirector/gallery.shtml
The ChartDirector charts have all the charm of the Excel charts - in the 90s.
You can also embed D3 into a htmlviewer (https://d3js.org).
i had only the need of bar and pie chart and made it self. you could use a container control and/or subclass a canvas.
would be nice - but it is a lot of work to make all kind of charts and in the end Xojo license price going up.
@Christian Schmitz
ich kann mir vorstellen das der Preis von ChartDirector für viele eine Hürde ist.
Vielleicht könntest Du aus den 30 Charts 3 unter Pakete machen als extra Produkte.
Nebenbei ich finde deine Chart Sammlung sehr gut.
Maybe try demo version and get the license with the next sale…
OT
this site have stunning examples, i wish xojo have this great base for drawings.
Interesting and this gives hopefully a better option for the user to setup his own dashboard.
This is very different to what we have.
ChartDirector it a C++ library we use to render charts in your application on Mac, Windows and Linux, client or server. Output chart as vector graphics as SVG or PDF to include it in documents.
D3 is something you load in HTMLViewer and feed with data. It uses web technology which was not available when ChartDirector started.
I am happy we have ChartDirector in Xojo, so we can use it.
I didn’t say that ChartDirector was bad. I just said that it looks very very very dated. The examples on their website have the same feel.
Me too, it’s a great plugin for Xojo.
But I also believe that web-technology will get more and more common practice. As I am doing a BI course now, webinar and with physical attendance of a consultant, I see the possibilities and needs for having a complete and flexible dashboard in a business-application. And yes, plenty tools available which are flexible and you can go as far as you want. Now I have to see how I can control and view different kinds of dashboards in my Xojo desktop and webapplication.
And yes, Chartdirector is still in charge since it’s working well and also easy to implement due to the examples that are provided with it.
Does anyone know if there is a small example /demo project somewhere available using the html viewer control and the D3js framework?
I don’t remember whose code this is: http://www.mothsoftware.com/downloads/d3example3.zip . The code isn’t up to date. There also is a wrapper for D3 now.
@Beatrix Willius Many thanks for all your information and the link to the example project. It works great! Awesome …