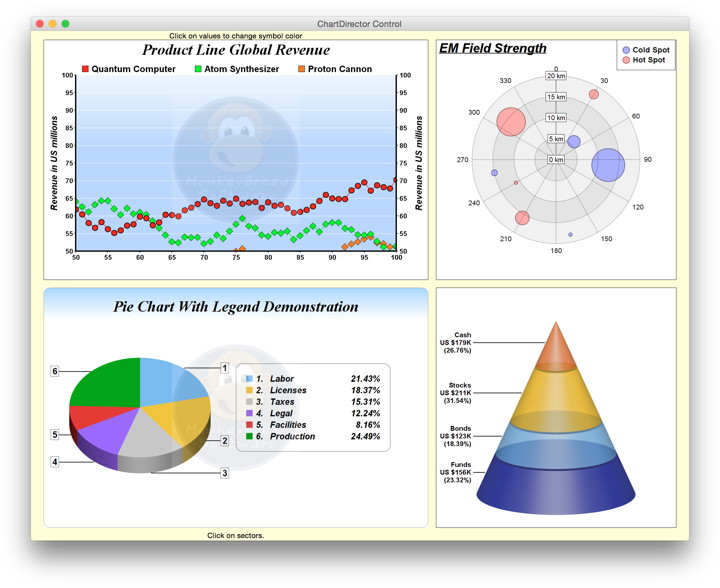
As you may know we have with ChartDirector a powerful library to make high quality charts for all operation systems and output them as pictures or PDF documents. We can show them interactively in a control to let the user click on values with the mouse.
As you may know we added 7 years ago the ScaleFactor property to the CDBaseChartMBS class. It allows you to set a scale factor, which is used by our plugin to multiple all size values before passing them to ChartDirector. This way we got scaling for HiDPI into ChartDirector years before it was built-in.
Since ChartDirector 7.0 there is a better way, which we like to highlight in this blog post. When PDF output was added, we got a new method setOutputOptions to set various values for the renderer. One of the setting added there was a dpi value. But this dpi value later was also made available for the bitmap renderer and you can set it to a newer value than the default 72 dpi:
// request higher DPI
c.setOutputOptions("dpi=192")
There is also a scale factor, which we will use in our examples in the future to scale the output by factor 2 or 4:
// 2x for higher DPI displays
c.setOutputOptions("bmpscale=2")
This way we can retire the use of our ScaleFactor and use the new bitmap scale factor there.
Please update your projects and enjoy the improved output in perfect scale. Let us know if you have questions.

