Hacking web api to help get plotter coordinates from an SVG file

This might be round a bout. First I’ll explain what I’m trying to do. Because that is the ultimate goal. Then ask my questions about the different methods to possibly get there.

I’m builing essentially a very large XY plotter using robot motors and a xojo app running on Raspberry Pi. The gpio stuff is handled and motors move fine. What I’m trying to accomplish now is getting my artwork which is an SVG file, into the series of coordinates needed to make the motors draw the thing. I already have code that moves the motors to draw stuff. And so what I need now is to convert SVG path commands into a series of coordinates along the line so I can move the motors along.

I wish I could post a video here. But just to further clarify, it draws this spiral programatically and the speed of the pen movement is consistent even as it gets larger and larger. This is done by constantly calculating the distance math per cycle. (Ignore the bumps, it’s because of interia due to the plotter not being bolted down)

So the most straight forward way of getting these coordinates that I’ve found is to use some javascript methods built into CSS or the SVG DOM of a browser as described in these two links:

Essentially, if I could, I’d call path.getPointAtLength() to return an SVGPoint with x & y coordinates. I’d also need to be able to call ‘paht.getTotalLength()’ to get the total distance so I can itterate through it in the appropriate steps for the scale I’m working with. So this could all work, but I’d need to be able to pass my path information to the web api and get the values back from the web api.

I looked at the source code for Graphics.DrawSVG. That’s a rabbit hole I don’t want to go down. Modifying that code seems much harder than hacking the web api.

There might be other command line methods I could run via shell.

Thanks!!!

2 Likes
  1. Perhaps I could use an external server to do it. Pass the path to the server and have it return the coordinates. But that seems like it might take an unknown amount of time. I need new coordinates in just a millisecond or two. So if I went this route I’d have to pregather this data. But it would be a lot of data. I could be drawing a line that take 15 minutes to draw and I need new coordinates for every 15 milliseconds. So in that particular case it would be 60,000 coordinates.

But also the drawing method is constantly recalcuating time and distance to get motor speed. So precalcuating all the points could lead to incremental errors.

I need the next coordinate to be calculated live in about 1 to 2 milliseconds.

  1. I was looking at monkeybread but I think it also just draws the svg into a picture. I don’t see where you can interact with the svg to get information out of it.

  2. Maybe using shell I can call svg.path · PyPI which can return a point along the path with 0.0 being the start and 1.0 being the end. But it doesn’t look as promising as the getPointAtLength() method.

Just an idea, but what about converting SVG into G-code and then interpret it with Xojo? Isn’t like you will need to implement the whole G-code specs, only the subset you need.

I think there are off the shelf SVG-to-GCode tools you can use.

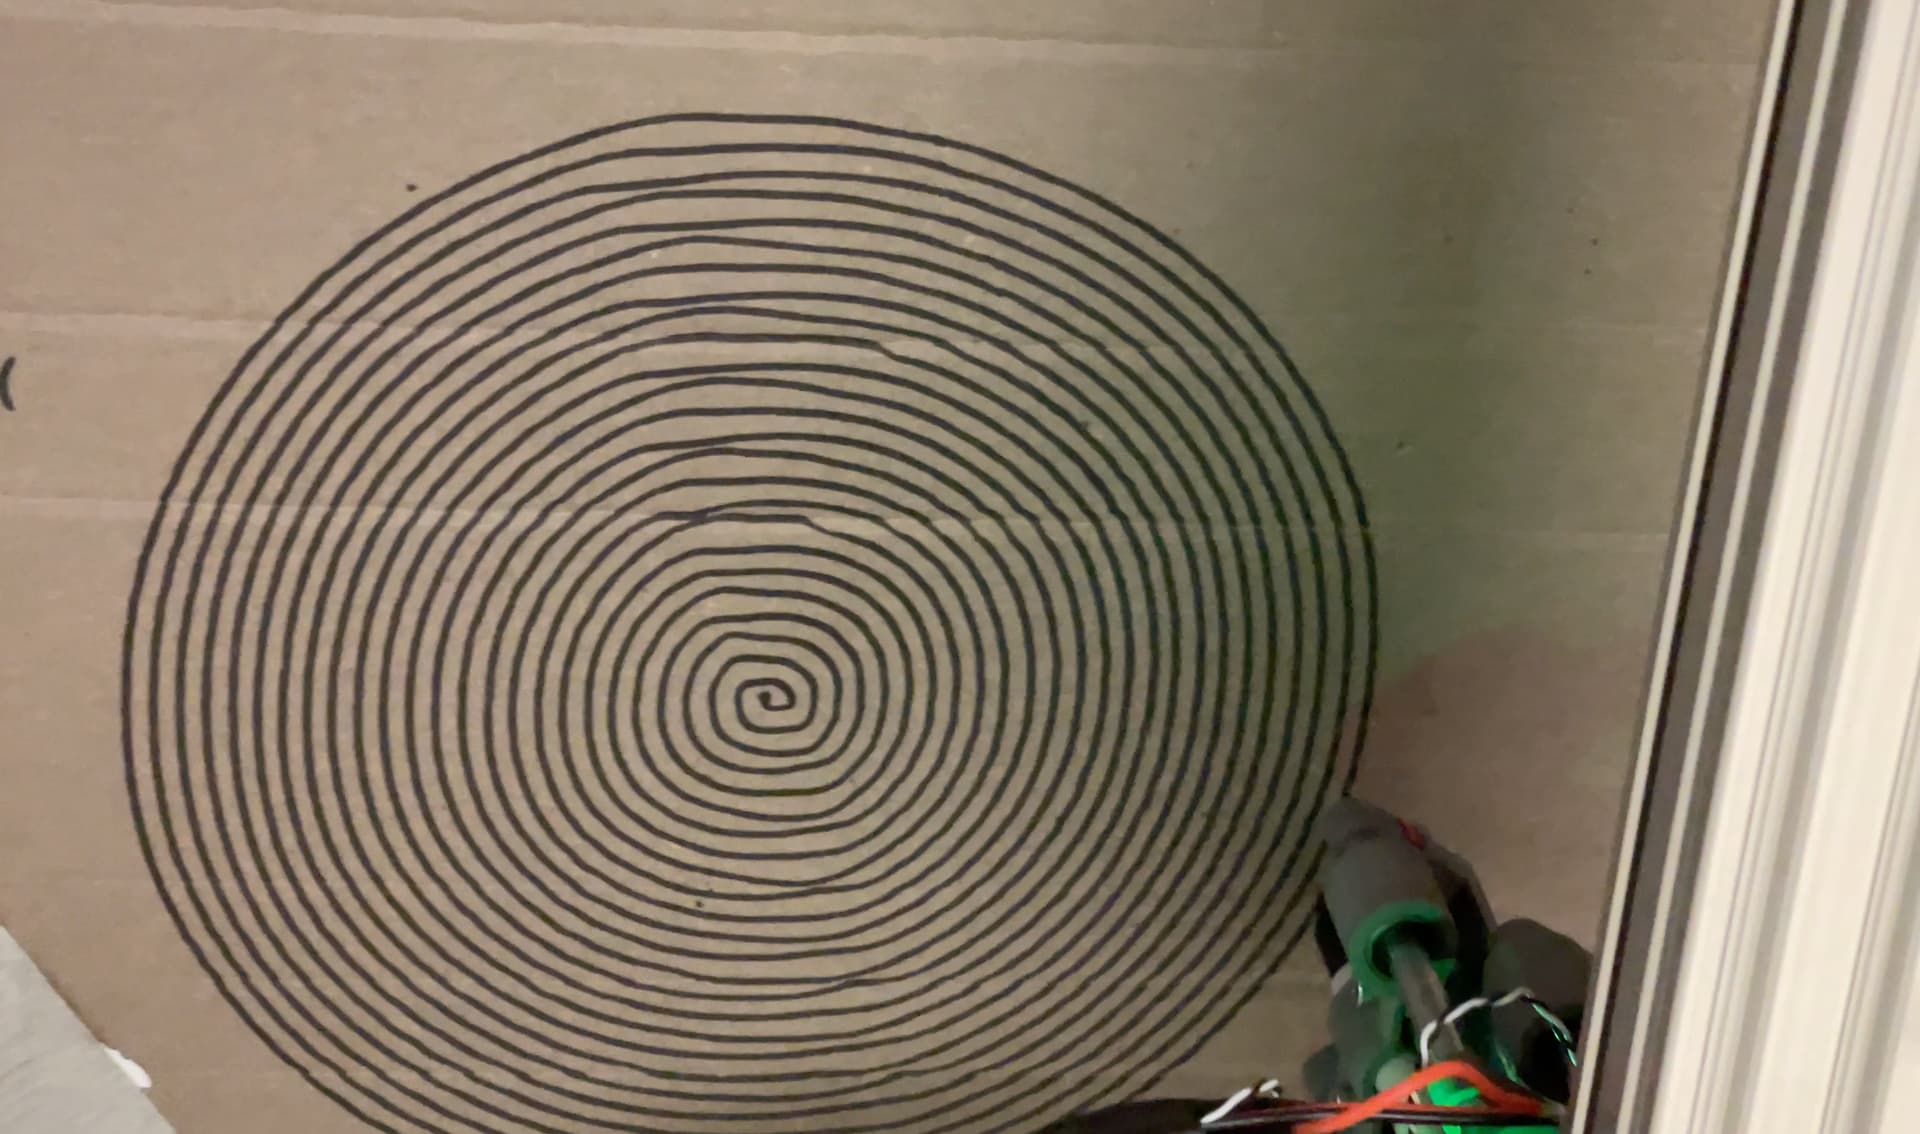
This is your lucky day. Not only do I work with plotters every hour at work, I’ve actually solved (almost) this exact problem.

(Some of this will be plotter information that is known to you, but I’m including it for everyone else)

Fundamentally, your plotter is capable of movement in the X and Y axis, in a series of discrete movements controlled by stepper motors which can move the plot head in multiples of their minimal distance. This means that the plotter head is capable of being placed anywhere on a large grid of points, a lot like a graphical display is broken up into pixels, and it can be moved in between these points, but it cannot be stopped in between two adjacent points.

Your plotter also has a Z axis - the ability to lift the plot tool off the plot area - but this is not relevant to our discussion.

Drawing a line aligned with either axis is simple. Maneuver the head to the beginning of the line; tell the appropriate stepper motor to execute a number of steps, which will be (length of line along axis) / (distance of each step).

However, when a line is not aligned with an axis - i.e., it has a slope or a curve - the solution is quite different. Here are the two cases to consider.

Straight line between two points

The solution to this depends on the capabilities of your plotter’s controller. If your plotter can correctly handle a command like “move 100 X steps and 71 Y steps”, then the case is solved. Problems may arise if the plotter’s internal calculations are not implemented in a way that correctly spreads any division/rounding errors across the entire length of the line, or discards them, both of which will cause inaccurate lines.

If the plotter produces errors, you’ll need to decompose your straight line down into line segments that the plotter can produce correctly, in a way that accounts for division and rounding. You will need to determine how small your lines must be - this will depend on the plotter’s controller. Generally speaking, you would recursively bisect your line, creating new line segments, until the line segments fall at or below the accuracy threshold of your plotter. Instead of “move 100 X steps and 71 Y steps”, you’ll have a very long list of commands that look more like “move 2 X steps and 1 Y step”, “move 3 X steps and 2 Y steps”, etc.

Cubic Bezier curves

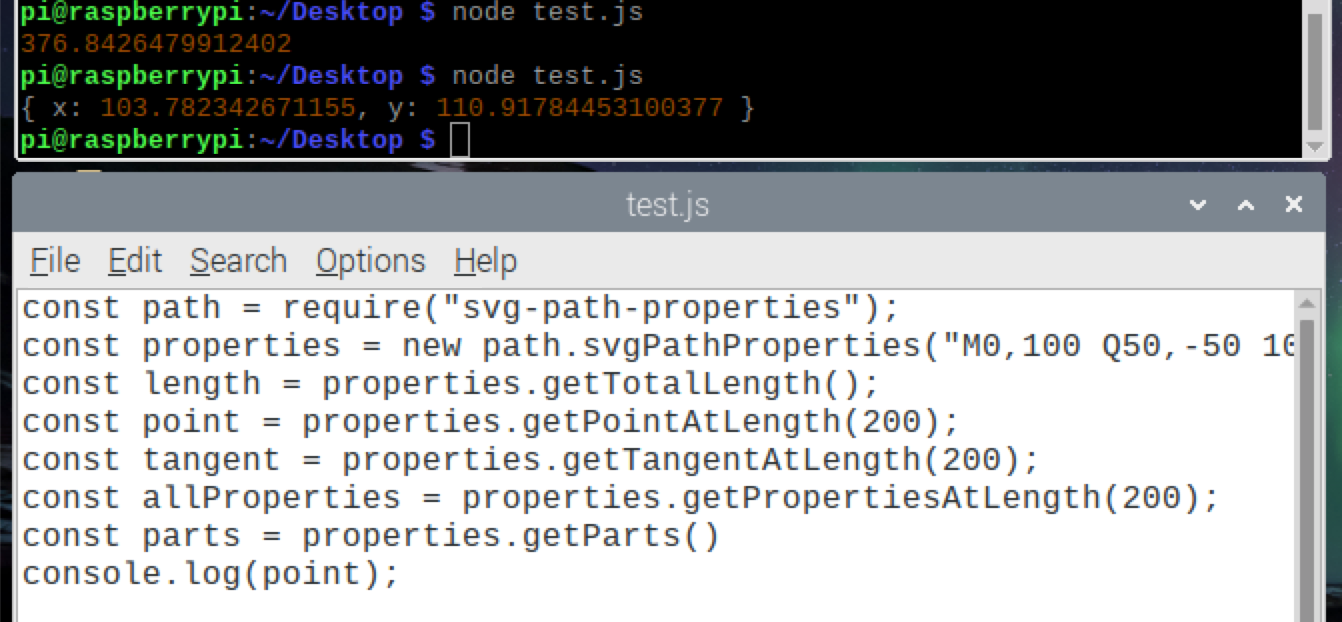
SVG uses cubic Bezier curves to define all of its paths where the line connecting any two points is not straight. Although the math behind Bezier curves is complex, it isn’t hard to implement and should be approachable for most developers.

Essentially, Bezier curves are described by parametric equations that defines a point on the curve at a percentage of its total length - T - where T ranges from 0 to 1. If you run the equations from 0 to 1 in .1 increments, you will produce 11 sets of (X, Y) coordinates and can draw a straight line between them to approximate the curve. This is a process called “flattening” - you are converting your curve into straight line segments.

However, using .1 is not a solution that will work in every circumstance. For example, the curve may have some wild loops and turns, and using .1 will produce a very jagged curve because the resulting line segments are too long. A smaller value will produce shorter lines and will approximate the curve more accurately.

The accuracy - or inaccuracy - of your flattening algorithm is thus controlled by the T increment (.1 in our example) and is referred to as “flatness”. Choosing the right flatness value is, again, related to the accuracy of your plotter, because it defines how small the resulting line segments are.

It is also acceptable to use variable T increments over different parts of the curve, depending on how “curvy” they are; some areas of the curve can be described using large T increments, while others require a smaller value.

For your situation, there are two approaches:

  1. For each curve you encounter, use a T parameter to generate straight line segments. If any of the line segments is too large for the plotter to accurately render, re-do the flattening using a smaller T parameter until all the line segments are acceptable to the plotter.

  2. Recursively bisect your Bezier curve until you produce a series of sub-curves where the starting and end points of each curve describe a straight line that can be accurately rendered by the plotter.

Approach 1 is probably the eaiser approach, but can produce too much accuracy in some areas of the curve, which may results in slow or odd output on the plotter. Approach 2 will produce ideal accuracy across the entire length of the curve but will be more complex to implement.

Caveats

The approaches outlines above for line and curves work for statically defined objects in an SVG file. However, SVG includes commands to transform vectors - for example, reflect, rotate, skew. These are beyond the scope of this discussion but must be taken into account if you expect to correctly render any SVG that follows the format spec. Again, the math surrounding these transformations is complex but not too difficult to implement. That said, getting your implementation right will be challenging; I would suggest you look into libraries that would distill a SVG file down to just straight lines and Bezier curves. This would hopefully also help your code deal with text.

1 Like

Considered that… If I use Gcode then I’ll have to write a Gcode interpreter and will still have to figure out how to plot curves with it. I couldn’t use an off the shelf plotter software like grbl because of the motors I’m using. They’re not stepper motors they’re robot motors. CAN Bus via serial.

You’re sure they aren’t stepper motors? How do you specify distance?

You could post a video to Youtube, and post the URL here.

1 Like

First. This is a completely custom build. Not an off the shelf plotter. I said that it was “essentially a plotter” but it has custom 3d printed parts and completely custom software. I had to write the api to talk to the motors from scratch. Which is basically bitbanging.

Second, I don’t need to implement a full support of SVG. Only the circle command which I already have written, and path which will handle everything else. I’ll make sure my artwork is only made up of these two primitives.

Yes, I know for a fact they’re not steppers. They’re smart pancake robot motors. I can specifcy an exact position for them to go to with a about a 50 micron step over a range of about 2 kilometers. There is a whole custom protocol that the motors use to communicate back and forth with the host. These motors are from a sponsor so I have to use them for this project. But also I wanted to use them because they’re amazing. These are the (type of) motors used in Spot, the Boston Dynamics Dog.

Also I can’t draw by sending them to a specific position and then the next and then the next. Small line segments. If I do that the motion won’t be smooth and it wrecks the motor. I’ve tried it. Instead I use my own methods to constantly calculate speed and distance, and by using precise timing I control when they will get where. This draws a perfectly smooth line and at a consistent speed for consistent ink/paint delivery. And while the end point is incrementally derived rather than absolute, I’m typically only a few 1/10ths of a mm off, which is acceptable for a robot that paints a 8 foot high mural. I also use absolute movements for every draw commands starting point.

And all of that is working. I’m far enough along in this project that I only need to know points along a path given a distance or percentage through that path. My already tested algorithms will drive the print head along that path.

What I am looking at today is node.js. Anyone know how to call a node.js javascript from inside xojo?

OK… I couldn’t put it on my main channel but I realized I have other channels.

Here it is in early stages drawing a spiral. Very smooth movement. The Spiral method takes a speed, radius, and a spacing between lines. I wrote this as a way of drawing filled in dots of different sizes.

https://youtu.be/THqCiRrMP3g

The bumps are from inertia when the motor changes direction. The frame wasn’t bolted down. That problem has been solved.

1 Like

Just an update…

Does exactly what I need. I can call it from the terminal using node.js

The first time it console.log’d out the length. The second time the point at length 200.

So this works. I have to look at ways to run javascript inside xojo or use shell to do it.

1 Like

Well, if you need to know X, Y for a percentage along a path, the Bezier stuff I mentioned is exactly what you’re looking for and would be straightforward to implement. If your path consists of more than one line segment, you’ll need to do the work to figure out, for example, which line segment is covering which percentage ranges of the path, but that’s not hard.

The math for directly calculating the length of a quadratic Bezier curve - which is what SVG uses - is extremely non-trivial if you were thinking to implement it yourself. Flattening the curve into straight line segments might give you a good enough result if you choose your T increment carefully and would be infinitely simpler to implement.

Am I missing something here?

Can you not write the js in node and send the response back to your Xojo app as json or similar on the loopback interface? In which case the URLConnection object should do it.

The MBS plugins support the DukTape Javascript engine so you might be able to use that.

The above screenshot example is in node.js. Yeah I think speed would be an issue there. I can’t send it off with a URL connection and wait for a return to come back when it feels like it. I need new calculations every 15 milliseconds and have other things to do during that phase. So probably I need these calculations to be done in about 1-2 ms.

Might work. I messaged them to see if the mbs plugin will allow me to include the library using path = require("svg-path-properties"); Cause that’ll be needed to make it work.

I’m concerned also that any solution using javascript is going to be too slow. I’d hate to spend the money on the plugin only to find out that it’s too slow. I might not have a choice but to precalculate the up to 100k XY values per draw command and itterate through them. I’d rather calculate them on the fly but :man_shrugging:

Latency is very rarely, when it feels like it :slight_smile:

IP communication on the loopback interface is an IPC and avoids the physical transmission and routing latency which is typically where the time goes when browsing internet pages. A cursory ping test on my rpi4 shows it can echo at least 64000 bytes in under 500 microseconds.

If you use an instance of node.js on the same rpi you can get on and do those other things, because the js code will be running on a separate thread within a separate multi-threaded process. My gut feeling is the latency within Xojo is going to be way larger than any latency introduced by HTTP over IPC.

I would not want to say a TCP connection over the loopback to a node.js instance would definitely be faster than instancing a shell or calling a plug-in from within Xojo, but I would definitely want to do a test, as it may be.

1 Like

Ok well that’s worth a try then.

I’ll check that out. I was starting to think I might just need to precalculate each path draw command to get all the coordinates. Which I guess is acutally doable. In between draw commands I can take as long as I need. Even the big spiral I drew took maybe 15 minutes to draw. That was prgrammatic and calculated as it went. But maths tells me that even a 15 min draw command would be around 60k XY pairs, which is managable. And probably no single draw would be that long.

But I’ll give this loopback a shot.

I won’t pretend to understand the maths but I am pretty good when it comes to bottlenecks and comms. Possibly why I would prefer using known good node.js code and an IPC, to transposing the maths into Xojo.

If you need to send many small payloads between node and Xojo you might want to consider using UDP instead of HTTP over TCP. Both node and Xojo have UDP sockets that are easy to implement.