Have a small Gcode controller here which draws text and lines onto stainless steel tubes.
Serial handling of the GRBL board is all fine. But now comes a challenge for me (o;
For text to be drawn I use normalized XY coordinates and move commands, which are of course of different sizes. The letter “I” uses less coordinates than letter “G”.
So what would be the best approach to store all capital letters and numbers in an array?
Can I just define a fixed size Array with the count being the number of all characters and then assign each element a different size array?
If I’m not completely misunderstanding you, do you want to have an array that then contains several characters, or rather their gcode?
I would build a class that contains the gcode, then one instance of it for each character.
Now you create an array of the type “your class” and can add as many characters as you like.
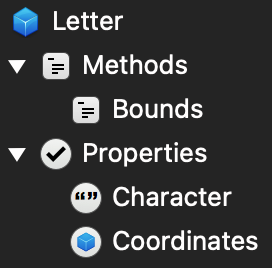
What @Marius_Dieter_Noetzel said. Store the coordinates as an array of Pairs in a property of the class, and give it a “Draw” method that iterates over the array to control the machine.
What you’ve suggested is possible - an array of arrays - but Xojo’s array handling makes this awkward at best. For that reason alone, an array attached to a custom class (as suggested above) is a cleaner solution.
This would have the advantage of giving you a place to store other useful information about the character, such as the overall character width.
I agree with the others that a class is the way to go, but you can create an array of arrays of different dimensions like this:
dim characters() as Variant

dim a() as Point
a.Append new Point(1,2)

characters.Append a

dim b() as Point
b.Append new Point(3,4)
b.Append new Point(5,6)

characters.Append b
How about a Dictionary, with the keys being the characters to be drawn, and the associated values being JSONItem objects containing an array of coordinates.
I also thought that a Dictionary would be efficient
// Fill Dictionary with Ascii(Char) as Keys and Points As values
Var dChar As New Dictionary
Var asciiValue As Integer

Var p_A As New Point
asciiValue = Asc("A")
p_A.X = 3
p_A.Y = 5
dChar.Value(asciiValue) = p_A

Var p_B As New Point
asciiValue = Asc("B")
p_B.X = 1
p_B.Y = 2
dChar.Value(asciiValue) = p_B
// …
Var p_lowerA As New Point
asciiValue = Asc("a")
p_lowerA.X = 7
p_lowerA.Y = 4
dChar.Value(asciiValue) = p_lowerA
// etc.

// retrieve from Dictionary (probably make a method for this)
Var someChar As String
someChar = "A"
Var somePt As New Point
Var xValue, yValue As Integer
somePt = dChar.Lookup(asc(someChar), "")
xValue = somePt.X
yValue = somePt.Y
Have to read through all carefully tomorrow and see what works best for me…
The hint with the Point variable is very good…though somehow I have to add up/down movements as well…but that’s up to me now (o;
I wouldn’t recommend this from an object hierarchy standpoint. Point has a number of useful methods, like Clone and DistanceTo, that work very differently in two dimensions versus three - subclassing shouldn’t disturb how the base class works with its data.
Besides, since he’s plotting these characters with a motorized tool, my hunch is that he’s describing a “tool up” and “tool down” action, not a true Z axis coordinate for each point.
Yes, and these continue to work, as Z is used here to raise and lower the tool and is not used to calculate the actual travel distance. Z can therefore be used for this special project without any problems. Of course, this cannot be used for points in “real” 3D space.
But, perhaps he needs different hight. If you use a CNC or a 3D printer, for example, the tool height changes. It is also possible that there is a height adjustment because the Z height varies depending on X and Y.
Thanks for rephrasing the second paragraph in my post. I’ve written plotter control software so this is a situation I’m familiar with.
If I were modeling this data, I’d store multiple arrays of data for each shape being plotted. Each line that the plotter draws would be its own array; so the letter “T”, for example, might have one array of points for the vertical part and a second for the cross at the top. This would allow the plotting software to intrinsically know when to lower the tool and when to raise it.
Furthermore, if you model the data in this fashion the plotting software can make certain inferences from the data and optimize its operations; for example, it could analyze the lines and determine the most efficient order in which to draw them based on their starting and ending coordinates.
Correct, plotters don’t have a real Z. They only know up and down. However, there are other machines that work with real Z values for the tool and these values also change during the process.