GraffitiSuite Web Edition has GraffitiProgressSemiCircle (click the Timed checkbox to see it in action) that can change the color of the progress indicator based on value, but does not display exactly like you’re requesting.
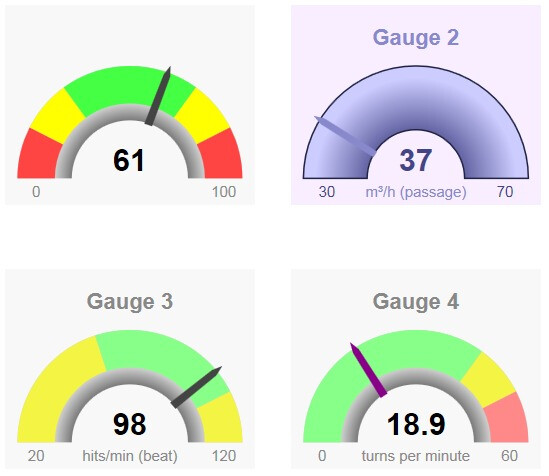
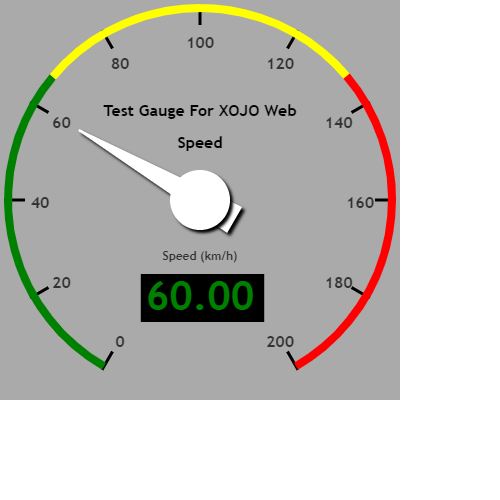
Thanks Anthony. That’s cool. But its not what i need for now. I am looking at some codes to draw the gauge using JavaScript in XOJO and also perhaps integrating external JS lib as WebSDK control at a later time.
Years ago I struggled with this and my non-technical manager solved it! He said why don’t you draw it as a Pie chart then chop off the bottom. I cover the bottom of the Pie with a white rectangle. There may be a better way.
Gate61 used to have a really nice clean-looking and highly-configurable gauge for desktop and web that used htmlViewer, but it’s not shown on their website anymore. I still use the desktop version and it works fine under Xojo 2021r2.1 and latest Mac and Win OSs. Maybe write to them as ask if they can send you a copy.
I am working to package this into a web container control.
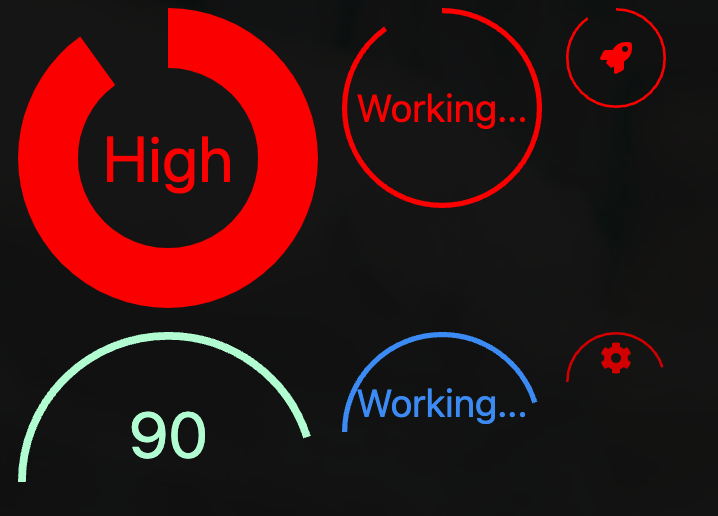
This is just a short term solution. The best would be to convert one of the many js based gauge libraries available on the net into WebSdk. It will be better.
But for now, this will be ok for my use.
I’ll share the code later once its safely wrapped in a web container control.
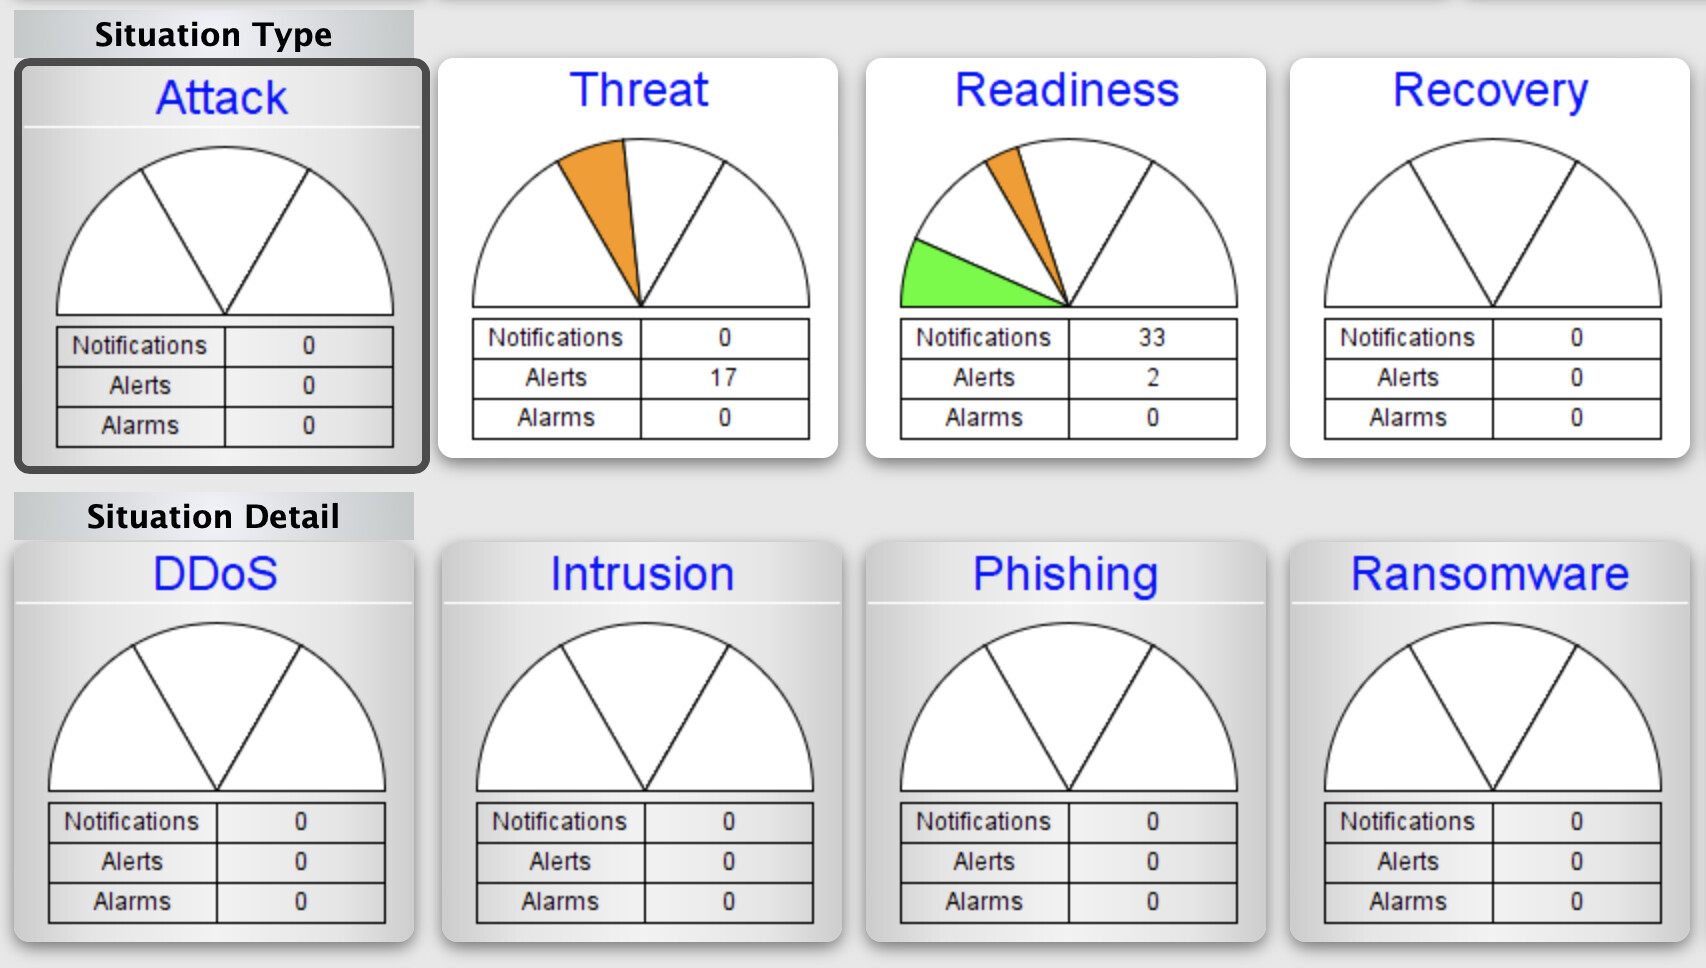
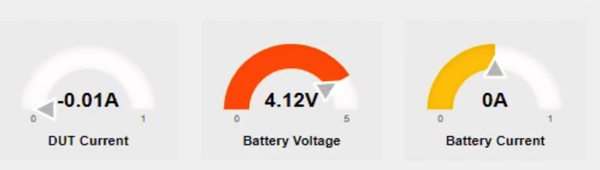
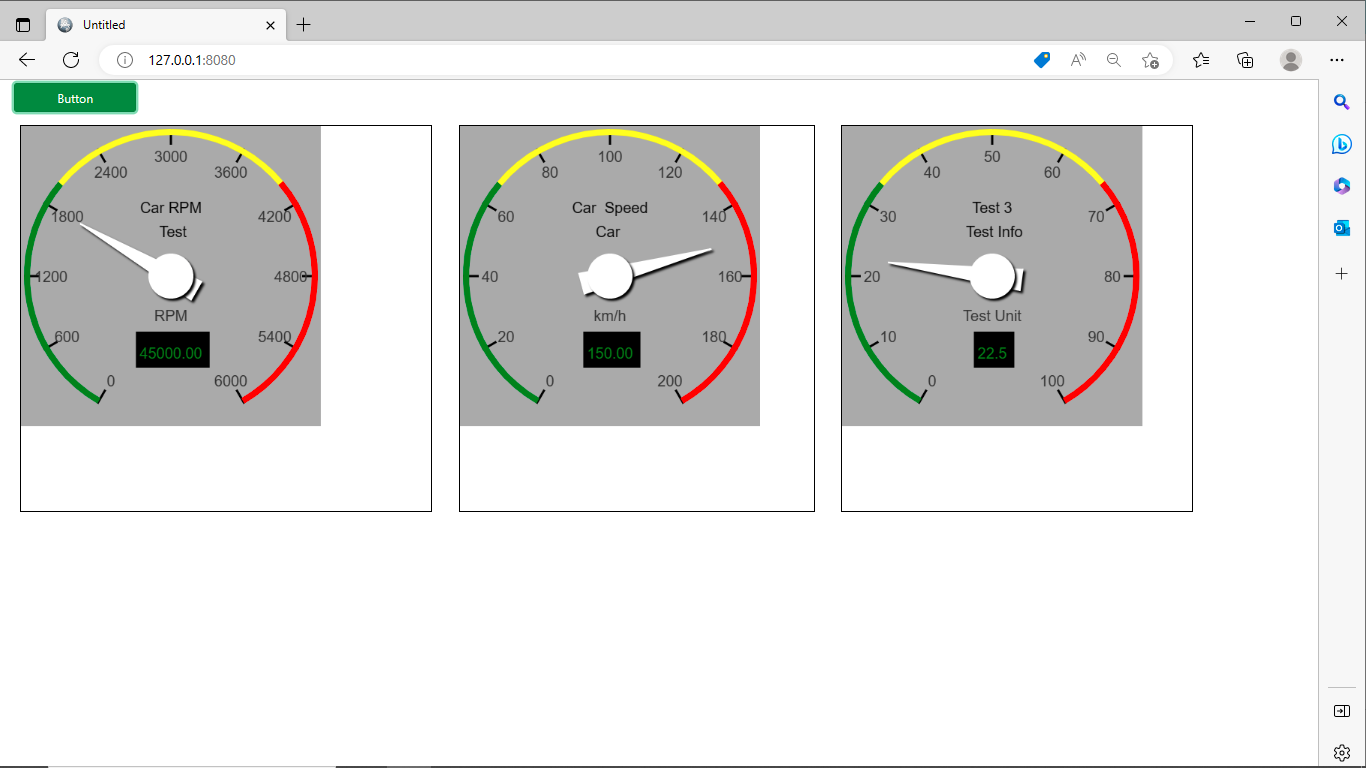
Some updates. I have packaged it as container control with limited customization options. I think there are something weird with regards to control anchoring / auto sizing for Xojo 2023 R1 Beta version (maybe i am wrong, but i am using it to develop the gauge control ). I’ll share once its more reliable ( the container control).
Hi, I’m developing a small project where I would like to put a control similar to the one shown in your work, would you have an example of how you integrated the javascript code in xojo to share? Thank you