Hello Group I have another problem. I would like to draw tower charts, but I have no idea how to do it … I was able to draw rectangles with a canvas … but for me it is very complicated. I have tried to read the documentation, but it is difficult for me. In Vb6 I chose the graph, I set the values and it was done … from what I understand with Xojo it is different, do I have to set everything myself? I would like to make a tower chart of some values that I have stored in variables for example A = 100 B = 1300 C = 200 D = 400. I’m also worried about the scale factor. Can anyone refer me?
you could wait for mbs offer Monkeybread Software - The MBS Xojo ChartDirector Plugin
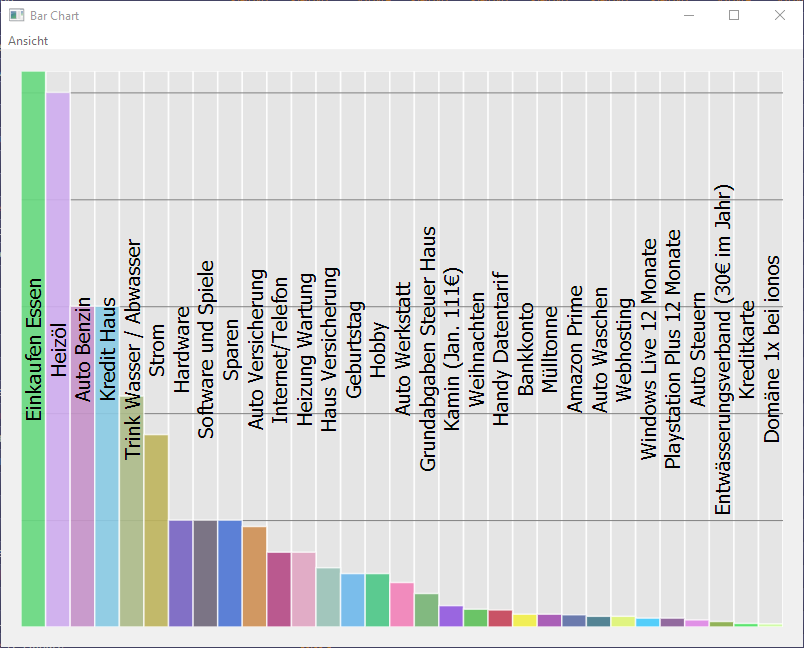
my example of a bar chart.
subclassed canvas
Private Property ValueMax As Double = 0


Private Const kToRadian as Number = 0.0174532925199444

Sub Paint(g As Graphics, areas() As Rect) Handles Paint
  #If TargetWindows
    #pragma unused areas
  #EndIf

  System.DebugLog("BarChartCanvas Paint")

  g.AntiAliased = True
  g.AntiAliasMode = Global.Graphics.AntiAliasModes.HighQuality

  Paint(g)

  System.DebugLog("BarChartCanvas Paint Ready.")


End Sub


Private Sub Calculate()

  System.DebugLog("Calculate")

  'Get Max Value for Scale Y
  Self.ValueMax = 0.0
  For i As Integer = 0 To data.LastRowIndex
    Self.ValueMax = Max(Self.ValueMax, data(i).Value)
  Next

  System.DebugLog("ValueMax="+Str(Self.ValueMax))

  For i As Integer = 0 To data.LastRowIndex

    data(i).ForeColor = PiChart.RandomColor

  Next

  Data.Sort(AddressOf ComparePiChart) 'sort small to big


End Sub


Public Function ComparePiChart(a as PiChart, b as PiChart) As Integer
  if a.Value > b.Value then return 1
  if a.Value < b.Value then return -1
  return 0

End Function


Public Sub Draw()
  Calculate

  'Self.Invalidate(True) 'paint event will come then ..
  Self.Refresh

End Sub


Public Sub DrawRect(g As Graphics, x1 As Double, x2 As Double, y As Double, foreColor As Color)

  System.DebugLog("g.Height="+Str(g.Height))
  System.DebugLog("y="+Str(y))


  Dim r As New RectShape

  r.BorderOpacity = 75  // 100 = opaque border
  r.BorderWidth = 1.5
  r.BorderColor = Color.White
  r.FillOpacity = 90
  r.FillColor = foreColor
  r.Width = x2 - x1
  r.Height = y
  r.x = x1
  r.y = g.Height -y

  g.DrawObject(r,r.Width / 2.0,r.Height/2.0)


End Sub


Public Sub DrawText(g as Graphics, x1 as Double, x2 as Double, y as Double, Name as String)

  y=0 'unused

  Dim s As New TextShape

  s.x = (x1+x2)/2.0
  s.y = g.Height / 2.0

  s.Value = Name
  's.FontUnit = FontUnits.Pixel
  s.FontName = "Tahoma"
  s.FontSize = Abs(x2-x1) * 0.8
  s.Bold = False

  s.HorizontalAlignment = TextShape.Alignment.Center
  s.VerticalAlignment  = TextShape.Alignment.Center
  s.Rotation = -90.0 * kToRadian

  s.BorderOpacity = 100
  s.BorderWidth = 1
  s.BorderColor = Color.White

  s.FillOpacity = 100
  s.FillColor = Color.Black 'Text Farbe

  g.DrawObject(s)
End Sub


Public Sub Paint(g As Graphics)

  PaintGrid(g)

  Dim x As Double = 0.0
  Dim y As Double
  Dim m As Double = ValueMax

  Dim st As Double = g.Width / Data.LastRowIndex

  For i As Integer = Data.LastRowIndex DownTo 0

    g.DrawingColor = Data(i).ForeColor

    y = (Data(i).Value / m) * g.Height

    DrawRect(g, x, x + st, y , Data(i).ForeColor)

    x = x + st

  Next

  'overlay text

  x = 0.0

  For i As Integer = Data.LastRowIndex DownTo 0

    DrawText(g, x, x + st, (Data(i).Value / m) * g.Height ,Data(i).Name)

    x = x + st

  Next


End Sub


Public Sub PaintGrid(g As Graphics)

  Dim x As Double = 0.0

  Dim st As Double = g.Width / Data.LastRowIndex

  For i As Integer = Data.LastRowIndex DownTo 0

    Dim l As New FigureShape
    l.FillOpacity = 10
    l.FillColor = Color.Gray
    l.BorderColor = Color.White
    l.BorderOpacity = 80
    l.BorderWidth = 1.5
    l.AddLine(x,0,x+st,0)
    l.AddLine(x+st,0,x+st,g.Height)
    l.AddLine(x+st,g.Height,x,g.Height)
    l.AddLine(x,g.Height,x,0)

    g.DrawObject(l)

    x = x + st

  Next

  st = (50.0 / (ValueMax / 12.0) ) * g.Height

  g.DrawingColor = Color.Gray

  For y As Double = g.Height DownTo 0 Step st

    g.DrawLine 0,y,g.Width,y


  Next

End Sub


Public Sub ReColor()
  For i As Integer = 0 To Data.LastRowIndex
    Data(i).ForeColor = PiChart.RandomColor
  Next
  'Self.Invalidate(True)
  Self.Refresh
End Sub


Public Property Data() As PiChart
recycled class PiChart
Public Property Value As Currency = 0


Public Property Name As String = "-"


Public Property ForeColor As Color = &c000000


Public Shared Function Create(Name as String, Value as Double) As PiChart
  Dim p As New PiChart
  p.name = Name
  p.value = Value
  p.foreColor = color.black

  return p

End Function


Public Shared Function RandomColor() As Color
  Dim myRND As New Random

  Return RGB(myRND.InRange(64,255),myRND.InRange(64,255),myRND.InRange(64,255))
End Function
1 Like
Last year or so, I wanted to do that (chart as pie), then I started to work on it, drink a coffee, go back home…
and in the afternoon, a bad idea comes to ming: “What for ?”…
Copy the data, paste them in the Free LibreOffice Calc and ask for a chart…
No need to re-invent the wheel.
And so I never go back to that project again (and no one asked me for that feature !
This is free and open source, made by me years ago.
If you want more advanced features I recommend using the MBS plug-in.
It’s great, I try to see if I can adapt it to my project.
Yes I had seen it but it is too complex for my need. Thanks.
Yes, I had thought of something like this too … but since I had done it with VB6 without spending much time on it, I wondered why in Xojo there is not something more dedicated, simpler … now i will try the code of friend MarkusR ![]()
1 Like
if you have Xojo for Web it have a build in chart (i think it use chart.js)
you can also think about using a report server, as example
ms SQL Server Reporting Services (SSRS)
or valentina studio Reporting for Xojo: Complete Reporting System for Xojo Apps
it comes a few times in year as offer.