Hello Martin,
I believe that the question is about a constant number of amplitudes with a varying x-axis distance, and to show this proportionately. The period is equal to the inverse of the frequency (period = 1/frequency), and aid in understanding, I rewrote the method to DrawWavyLine1 that accepts frequency and not period.
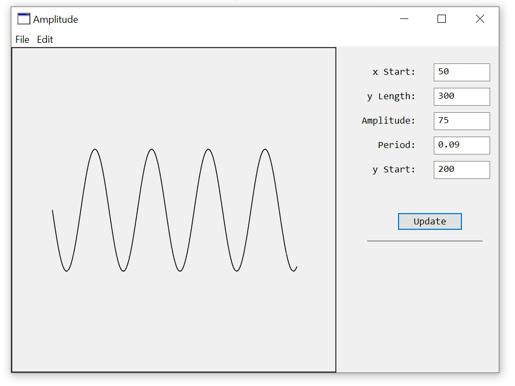
The following screen grab is a modified version of the first example.
A modified DrawWavyLine1 method is shown below:
[code]Public Sub DrawWavyLine1(g as Graphics, XStart as Double, YLength as double, Amp as double, Frequency as Double, YStart as Double)
//y = asin(b(x-h))+k
//a = amplitude, b = period, h = horizontal shift, k = vertical shift, x = x-axis
//XStart=Starting pixel coordinate on x-axis
//YLength=Total length of the wave in pixels
//Amplitude=Height of the wave from the middle to top of the wave in pixels
//Frequency=Length of the repeating wave(Cycles per length unit)
//YStart=Starting pixel coordinate on the y-axis
Dim i as integer
For i = 0 to YLength
g.ForeColor = RGB(255,0,0) //Red
g.DrawLine(i+XStart, Ampsin((1/Frequency)(i))+YStart, i+1+XStart, Ampsin((1/Frequency)(i+1))+YStart)
Next i
//Draw a border
g.ForeColor = RGB(0,0,0) //Black
g.DrawRect(0,0,g.Width, g.Height)
End Sub
[/code]
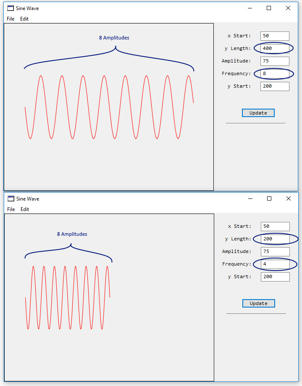
The way to have the same number of amplitudes for a given length is to change both the y-length and frequency by the same factor that you mentioned. If the size of the wave is to be doubled by multiplying by 2, then multiply both the y-length value (from 2002 = 400) and the Frequency (42=8), which will increase the size of the wave length and space the waves evenly.
I hope I interpreted the question correctly. Is this what was wanted?
Edit: Oops: I forgot the link to download the demonstration programme: SineWaveAmplitude.xojo_binary_project
P.S. I am adding these types of questions with explanations to my blog at scispec.ca for others to view and maybe understand a little more about math(s) and graphics.