hello,
I would like to draw a math function using DrawLine ().
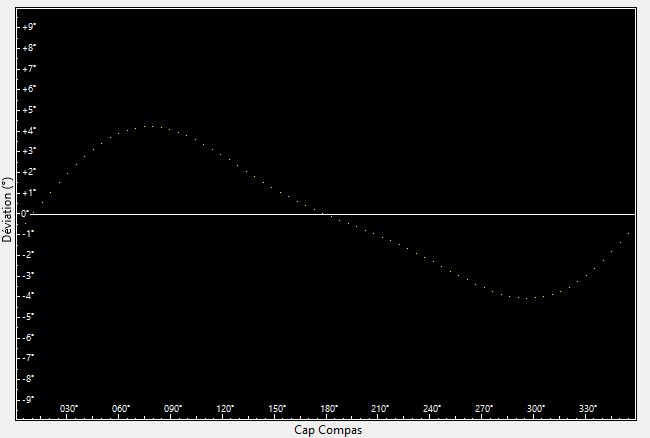
This code use Pixel() displayed each 5° from 0 to 360°.
I post the code and output image in this topic.
dim yo(360),xo(360) as double
dim i as integer
dim yy, cfA,cfB,cfC,cfD,cfE as double
yy=(canvas1.Height/2) // to adjust X axe in half canvas.Haight
const deg2rad as double =0.017453292
cfA = 0.29
cfB= 3.68
cfC = -0.47
cfD=0.85
cfE = -0.387
For i = 0 To 360 step 5
xo(i) = i+1
yo(i) =cfA + cfB * sin(i*deg2rad) + cfC * cos(i*Deg2rad) +cfD * sin(2*i*Deg2rad)+cfE * cos(2*i*Deg2rad) //Function to draw
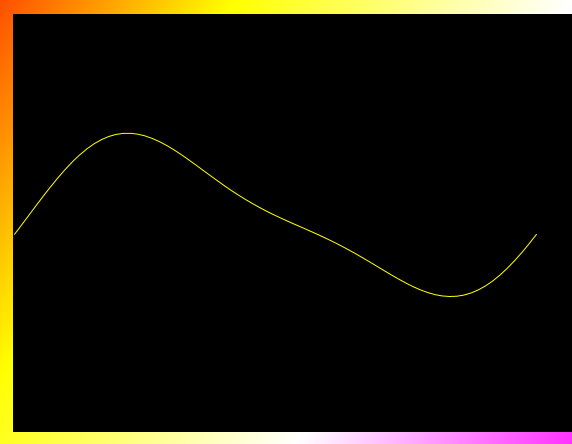
g.Pixel( xo(i)*1.45,yy-yo(i)*20)=color.Yellow // xo() and yo() are adjusted for the canvas (1.45,20)
//I want to use DrawLine method to connect pixels from 0 to 360
here - but i used path, hope you can use it in your xojo version
Sub Paint(g As Graphics, areas() As REALbasic.Rect) Handles Paint

  g.DrawingColor = Color.Black
  g.FillRectangle(0,0,g.Width,g.Height)

  '---

  Dim y,x As Double
  Dim i As Integer
  Dim yy, cfA,cfB,cfC,cfD,cfE As Double

  yy=(canvas1.Height/2) // to adjust X axe in half canvas.Haight

  Const deg2rad As Double = 0.017453292
  cfA = 0.29
  cfB = 3.68
  cfC = -0.47
  cfD = 0.85
  cfE = -0.387

  Var p As New GraphicsPath

  For i = 0 To 360 Step 5

    'Function to draw
    x = i + 1.0
    y = cfA + cfB * sin(i * deg2rad) + cfC * cos(i * Deg2rad) + cfD * sin(2.0 * i * Deg2rad) + cfE * cos(2.0 * i * Deg2rad)

    'Scale and Translate
    x = x * 1.45
    y = yy - y * 20.0

    If i = 0 Then
      p.MoveToPoint(x, y) 'First
    Else
      p.AddLineToPoint(x, y)
    End If

  Next

  g.DrawingColor = Color.Yellow
  g.DrawPath(p, False)


End Sub
Sub Paint(g As Graphics, areas() As REALbasic.Rect) Handles Paint
g.DrawingColor = Color.Black
g.FillRectangle(0,0,g.Width,g.Height)
'---
Dim y, x As Double
Dim yy, cfA, cfB, cfC, cfD, cfE As Double
yy=(canvas1.Height/2) // to adjust X axe in half canvas.Haight
Const deg2rad As Double = 0.017453292
cfA = 0.29
cfB = 3.68
cfC = -0.47
cfD = 0.85
cfE = -0.387
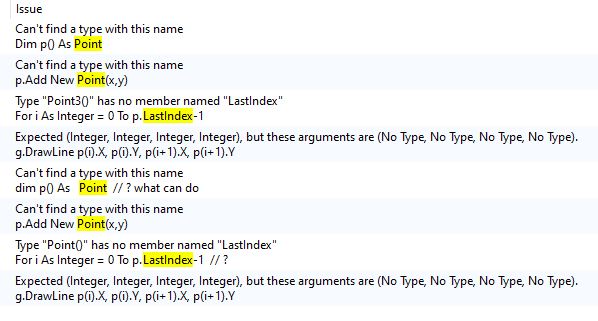
Var p() As Point
For i As Integer = 0 To 360 Step 5
'Function to draw
x = i + 1.0
y = cfA + cfB * sin(i * deg2rad) + cfC * cos(i * Deg2rad) + cfD * sin(2.0 * i * Deg2rad) + cfE * cos(2.0 * i * Deg2rad)
'Scale and Translate
x = x * 1.45
y = yy - y * 20.0
p.Add New Point(x,y)
Next
g.DrawingColor = Color.Yellow
For i As Integer = 0 To p.LastIndex-1
'use a pair of points
g.DrawLine p(i).X, p(i).Y, p(i+1).X, p(i+1).Y
Next
End Sub
'Function to draw
x = i + 1.0
y = cfA + cfB * sin(i * deg2rad) + cfC * cos(i * Deg2rad) + cfD * sin(2.0 * i * Deg2rad) + cfE * cos(2.0 * i * Deg2rad)

'Scale and Translate
x = x * 1.45
y = yy - y * 20.0

p.Add New Point(x,y)
Next
g.ForeColor = Color.Yellow
For i As Integer = 0 To p.LastIndex-1
'use a pair of points
g.DrawLine p(i).X, p(i).Y, p(i+1).X, p(i+1).Y
Next
what is the problem to create a new class with x,y property?
.LastIndex-1 could be Ubound ( p ) -1 in older xojo
unfortunately array.add is also something new …
maybe just use a x and y array with the count you need
you need the data for 2 angles because you will draw a line from as example 0 degree to 5 degree.
the next line is from 5 degree to 10 degree.
if you have a point list it would have index 0,1,2 for the degree 0,5,10 (if you collect data in 5 degree steps.)
It’s not necessary to save all of the points in an array. It’s only necessary to save the previous point. This is what I usually use to draw connected points:
lastX = 0
lastY = myFunction(lastX)
for x as double = 1 to maxX
  y=myFunction(x)
  g.drawline(lastX,lastY,x,y)
  lastX=x
  lastY=y
next
lastX = 0
lastY = myFunction(lastX)
for x as double = 1 to maxX
  y=myFunction(x)
  g.drawline(lastX,lastY,x,y)
  lastX=x
  lastY=y
next
[/quote]

>

  Dim y, x As Double
  Dim yy, cfA, cfB, cfC, cfD, cfE As Double
  dim i as integer
  yy=(canvas1.Height/2)       // to adjust X axe in half canvas.Haight

  Const deg2rad As Double = 0.017453292
  cfA = 0.29
  cfB = 3.68
  cfC = -0.47
  cfD = 0.85
  cfE = -0.387
  dim lastX,lastY,maxX  as double
  maxX = 360
  lastX = 0
  lastY =cfA + cfB * sin(lastx*deg2rad) + cfC * cos(lastx*deg2rad) +cfD * sin(2*deg2rad)+cfE *
  cos(2*lastx*Trigo.rad)              // myFunction(lastX)

  for i = 1 to maxX
    y= cfA + cfB * sin(i*deg2rad) + cfC * cos(i*deg2rad) +cfD * sin(2*i*deg2rad)+cfE * cos(2*i*deg2rad)
    //myFunction(x)

    g.ForeColor = color.green
    g.drawline(lastX,lastY,x,y)
    lastX=i
    lastY=y
  next
Unfortunately does not run.

As i explain in the beginning of this topic,  want to connect the points by line as show in screenshot.
MarkusR gives a good solution, but my xojo 2015r1 does not support a newest features.
Sub Constructor(x as double, y as double)
me.X=round(x) //or directly x if no rounding is needed
me.Y=round(y)
End sub
Dim p() As DJpoint
For i = 0 To 360 Step 5
'Function to draw
x = i + 1
y = cfA + cfB * sin(i * deg2rad) + cfC * cos(i * Deg2rad) + cfD * sin(2.0 * i * Deg2rad) + cfE * cos(2.0 * i * Deg2rad)

'Scale and Translate
x = x * 1.71
y = yy - y * 20.0

//p.Add New DJPoint(x,y)
p.Append New DJPoint(x,y)
Next
g.ForeColor = Color.Yellow
For i = 0 To p.Ubound-1
'use a pair of points
g.ForeColor = rgb(0,160,0)
g.DrawLine p(i).X, p(i).Y, p(i+1).X, p(i+1).Y
Next
MarkusR, this code is yours adapted to xojo 2015r1.
It’s running well.
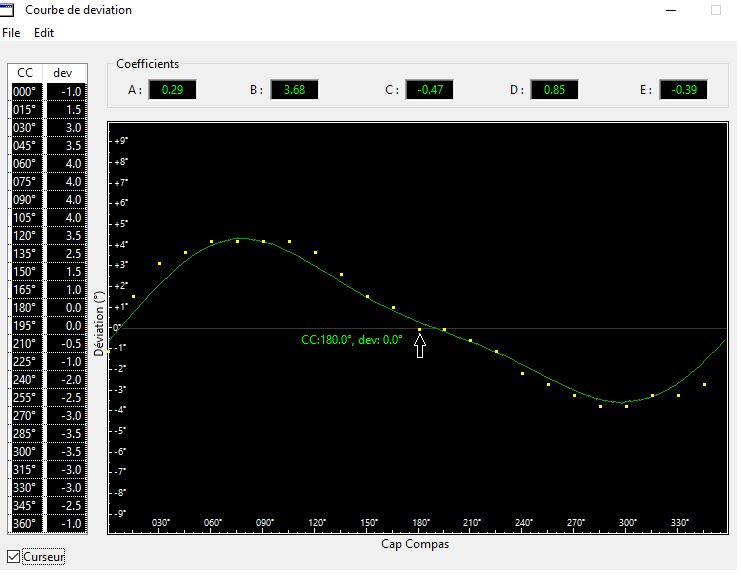
I would like to continue in same topic, i have wrote code to convert mouse coordinates to canvas coordinates (curve).
i discover that with tooltip control it is possible to show the values when cursor is moving on the curve.
Any example or link ?
If ChkCursor.State =checkBox.CheckedStates.Checked then
LbltoolTip.Left=x -  (lbltoolTip.Width/2 )+50  // convert Mouse.X to CC
LblToolTip.Top=y+  (lbltoolTip.Height+60)    // convert Mouse.Y to dev

if (mX <0 or mY < 0 or mX > cnvCompas.Width or  mY>cnvCompas.Height) then
  LblToolTip.Visible =false
else
  LblTooltip.Visible= true
end if

LblToolTip.text = "CC:" +format(cc,"000.0") +"°" +", dev: " +format(dv,"-#.0")+"°"
end if
CnvCompas.invalidate
As is shown on the attached screenshot mouse pointer display a correct values.
But the lblToolTip.text is flashing to white color when mouse cursor move.