Hi all,
Overview:
I have a console app that is continuously eating memory while it operates. The number of Objects do not increase while the memory consumption continues to increase until my app stops functioning. I am using Sentry.io and I do not receive any exceptions. Additionally verified that I am using weak references to the Parent class to child socket class relationship.
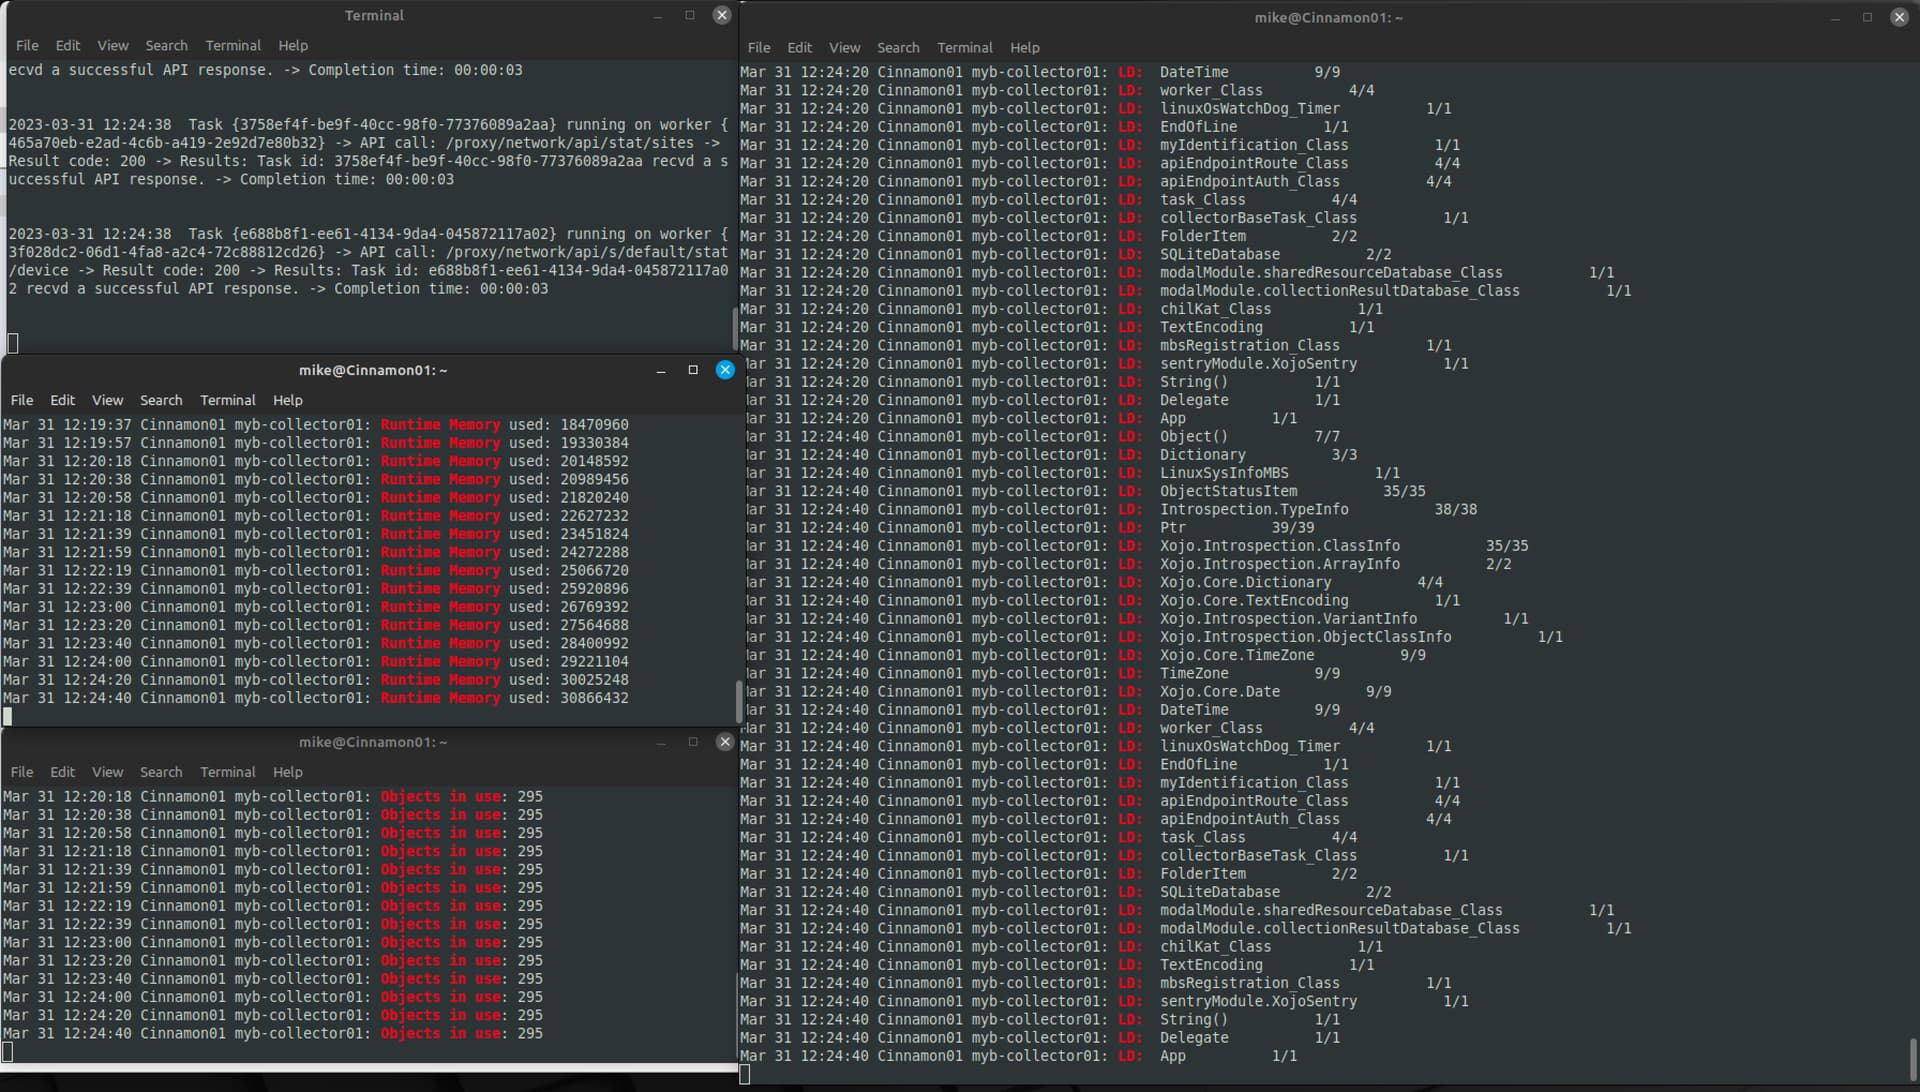
I have code that I adapted from @Kem_Tekinay’s post here from a few years ago. This is output along with other stats I am using to try to isolate this leak.
Here is my linux setup:
- Linux Mint 21.1
- 12GB of RAM / 128G SD hdd space
- Xojo 2022 r4.1 (linux)
- This result happens on compiled linux versions and also in the IDE debugger
I know memory leak issues are not super easy to trap, but any guidance is always appreciated to what I have tried so far.
Thank you again
Mike
Without seeing your code, all we can do is guess. Poorly.
The first thing that comes to mind is, are you adding onto a string or array somewhere that is continuously growing?
Also, does the it do the same if running on Mac or Windows?
Essentially I have 4 task_Classes that have one URL Connection socket each —> They make an API route call – Receive the results → update a sqlite table and then rinse and repeat.
This does the same thing in Mac OS x so I am equal opportunity leaking  I will re-review to make sure that I am not keeping any persistent arrays as I do have a bunch.All of my arrays are local variables that are designed to run out of scope. – But you know how this goes over time I do have specifically designed class arrays I keep so I can definitely check all of these.
@Kem_Tekinay thank you for this push and I’ll let you know what I find. Yeah its too much code and it will be very time consuming if I try to put it into a test project (at this point at least )
Much appreciated.
Mike
I do have a question about timers in console apps. I am using a few subclassed timers without the use of delegates or addhandlers. This wouldn’t be of concern would it for a console app? I normally work within Mac/Windows apps so I wasn’t sure on this topic.
Thank you again
No.
You only have one DoEvents loop, right?
FYI: I will rerun my baseline of tests on mac after I let the array checker function report for a little while since I have more datapoints now.
Would the size of the memory increment help point to a source of that size?
This is my app.run() method fwiw. I removed other logging / trivial code to make it a bit more readable. I know this really won’t help much but it may set the stage if I start to post other functions/methods/classes perhaps? Thanks again.
// START SENTRY.IO
Var myDsnStr as Text = "<___>"
sentryClass = new sentryModule.XojoSentry(myDsnStr, "<___>")

// INSTANTIATE COLLECTOR DATA RESULTS DATABASE
Var instantiateControllerResultsDbSuccessBln as Boolean  = modalModule.instantiateResultsDatabase()
If instantiateControllerResultsDbSuccessBln = false Then
  // CANT CONNECT TO EVENT LOGGING DATABASE
  Call printSystemStoppedMsg("Can't connect to the Controller Results SQLite Db file!")
  quit()
End If

// INSTANTIATE SHARED RESOURCE DATABASE
Var instantiateSharedResourceDbSuccessBln as Boolean  = modalModule.instantiateSharedResourceDatabase()
If instantiateSharedResourceDbSuccessBln = false Then
  // CANT CONNECT TO EVENT LOGGING DATABASE
  Call printSystemStoppedMsg("Can't connect to the Shared Resource SQLite Db file!")
  quit()
End If

// PROCESS ANY ARGUMENTS PASSED BY THE CLI
Call processArg(args)

// GET STARTUP JSON CFG FILE
Var startUpCfgJsonStr as String = getCfgFile()
If startUpCfgJsonStr = "noCfgFile" Then
  // NO CONFIG FILE FOUND HALT SYSTEM
  Call printSystemStoppedMsg("No CFG file found!")
  quit()
End If

// LOAD STARTUP JSON CFG FILE SETINGS
Var startupConfigClass as collectorBaseTask_Class = loadStartUpCfg(startUpCfgJsonStr)
If startupConfigClass = Nil Then
  // CONFIG FILE FORMAT MALFORMED
  Call printSystemStoppedMsg("CFG File is malformed!")
  quit()
Else
  scheduleSubSystemUbntModule.runningCfgJsonStr = startUpCfgJsonStr
  scheduleSubSystemUbntModule.startupCfgJsonStr = startUpCfgJsonStr
End If

// INSTANTIATE THIS COLLECTOR'S IDENTITY CLASS
myIdentificationClass = New myIdentification_Class(startupConfigClass)

If useLeakCheckBln = True Then
  // LAUNCH LEAK DETECTOR
  linuxOsStatsWatchDogTimer = New linuxOsWatchDog_Timer
  linuxOsStatsWatchDogTimer.Enabled = True
  linuxOsStatsWatchDogTimer.period = 20000
  linuxOsStatsWatchDogTimer.RunMode = linuxOsWatchDog_Timer.RunModes.Multiple
End If

// START WORKER SYSTEM
Call scheduleSubSystemUbntModule.spawnWorkers()

// DISPATCH TASKS TO WORKERS (ROUND ROBIN ALGORITHM)
Var numOfTasksRunningInt as Integer = scheduleSubSystemUbntModule.taskDispatcher(startupConfigClass)

// RUNNING
do
  DoEvents(myDoEventTimerInt) // CFG FILE HAS THIS AT 500ms CURRENTLY
loop
@Kem_Tekinay - The two persistent class array’s I manage are not increasing and are at the expected 0 base count.
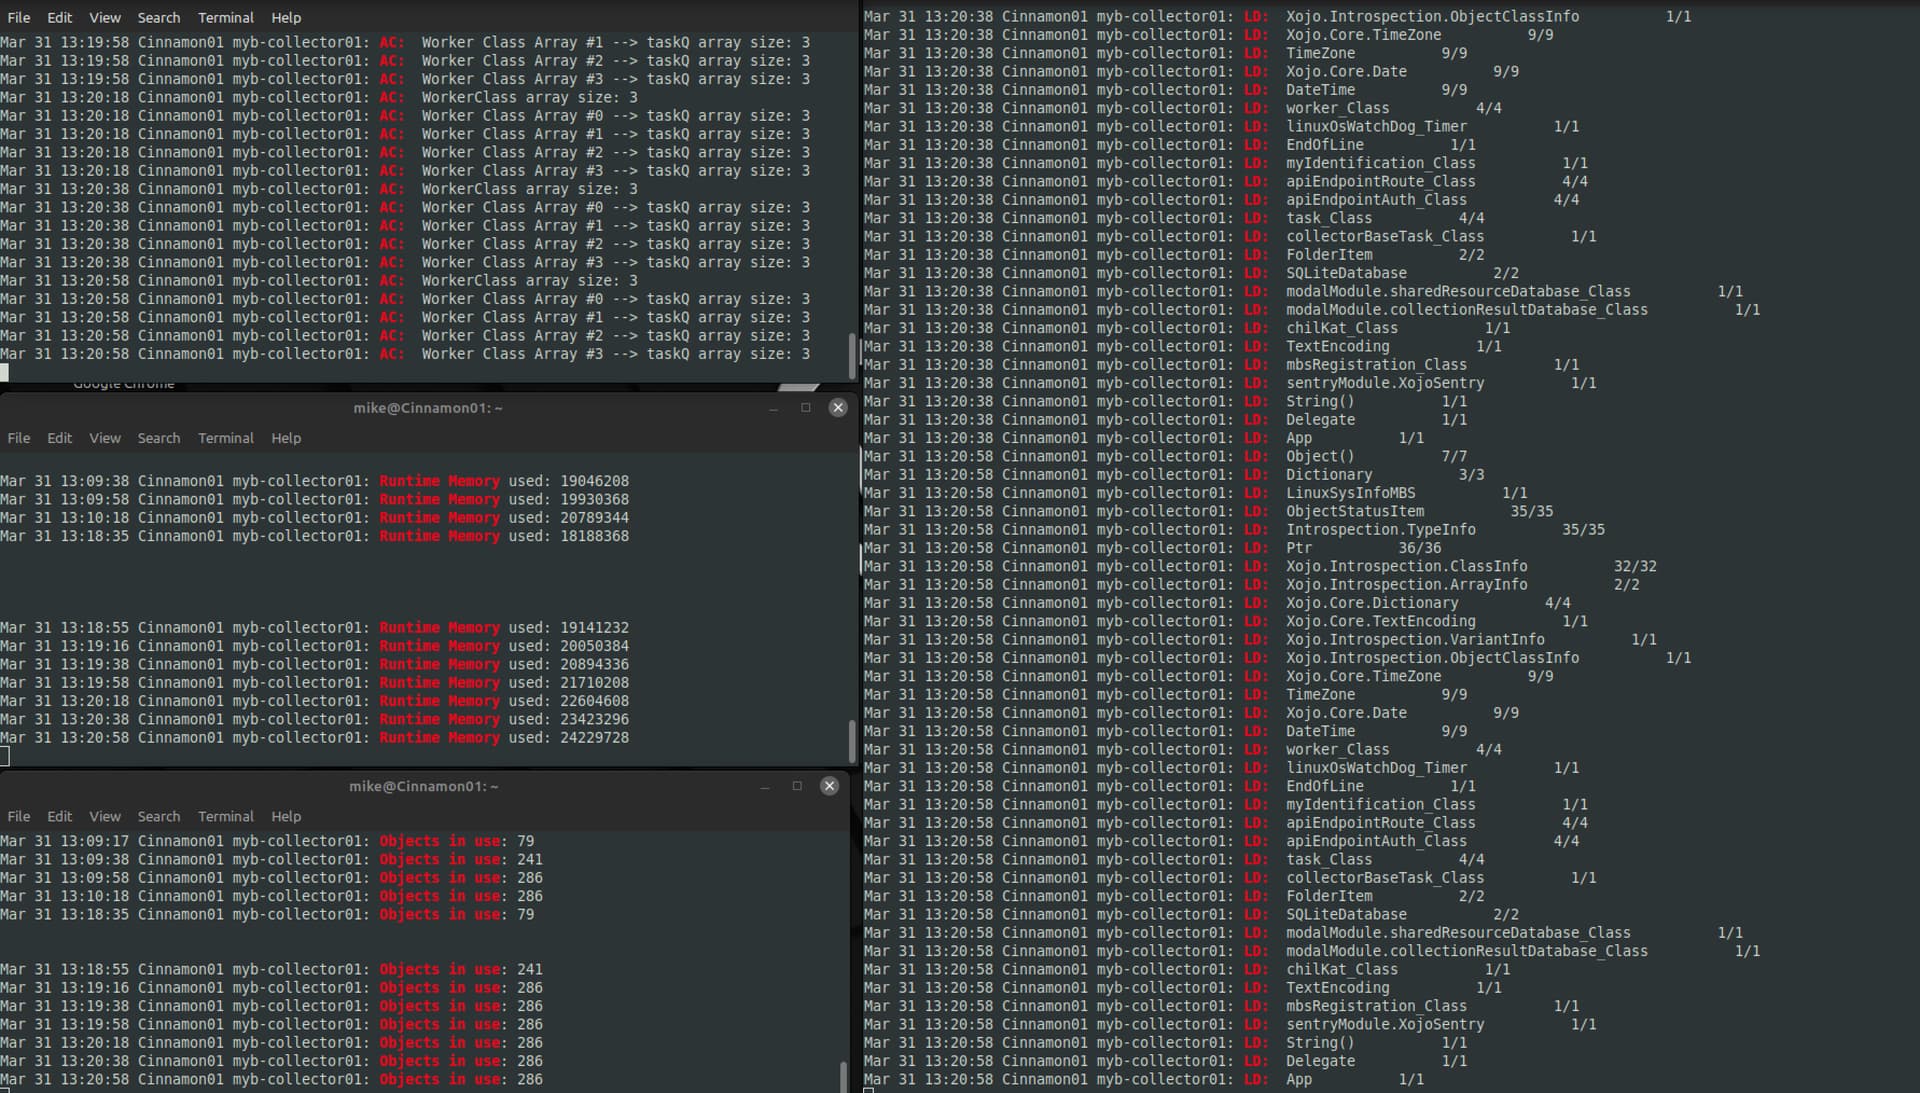
@Ian_Kennedy Memory wise I run Kem’s adapted code every 20seconds and here are the increments specifically:
Mar 31 13:18:55 Runtime Memory used: 19141232
Mar 31 13:19:16 Runtime Memory used: 20050384 (+4.7%)
Mar 31 13:19:38 Runtime Memory used: 20894336 (+4.21%)
Mar 31 13:19:58 Runtime Memory used: 21710208 (+3.9%)
Mar 31 13:20:18 Runtime Memory used: 22604608 (+4.12%)
Mar 31 13:20:38 Runtime Memory used: 23423296 (+3.62%)
Mar 31 13:20:58 Runtime Memory used: 24229728 (+3.44%)
Mar 31 13:21:18 Runtime Memory used: 25042160 (+3.35%)
Mar 31 13:21:38 Runtime Memory used: 25950160 (+3.63%)
Mar 31 13:21:58 Runtime Memory used: 26750304 (+3.08%)
Mar 31 13:22:24 Runtime Memory used: 38033136 (+42.18%)
Mar 31 13:22:44 Runtime Memory used: 28819296 (-24.23%)
So it’s going up by 800-900K in each step and then suddenly it goes up by 11MB in once chunk, then drops by 9MB. What in the code is likely to do those things. Is it just partial processing that causes the massive rise and then a small drop or is it that process that is causing the leak.
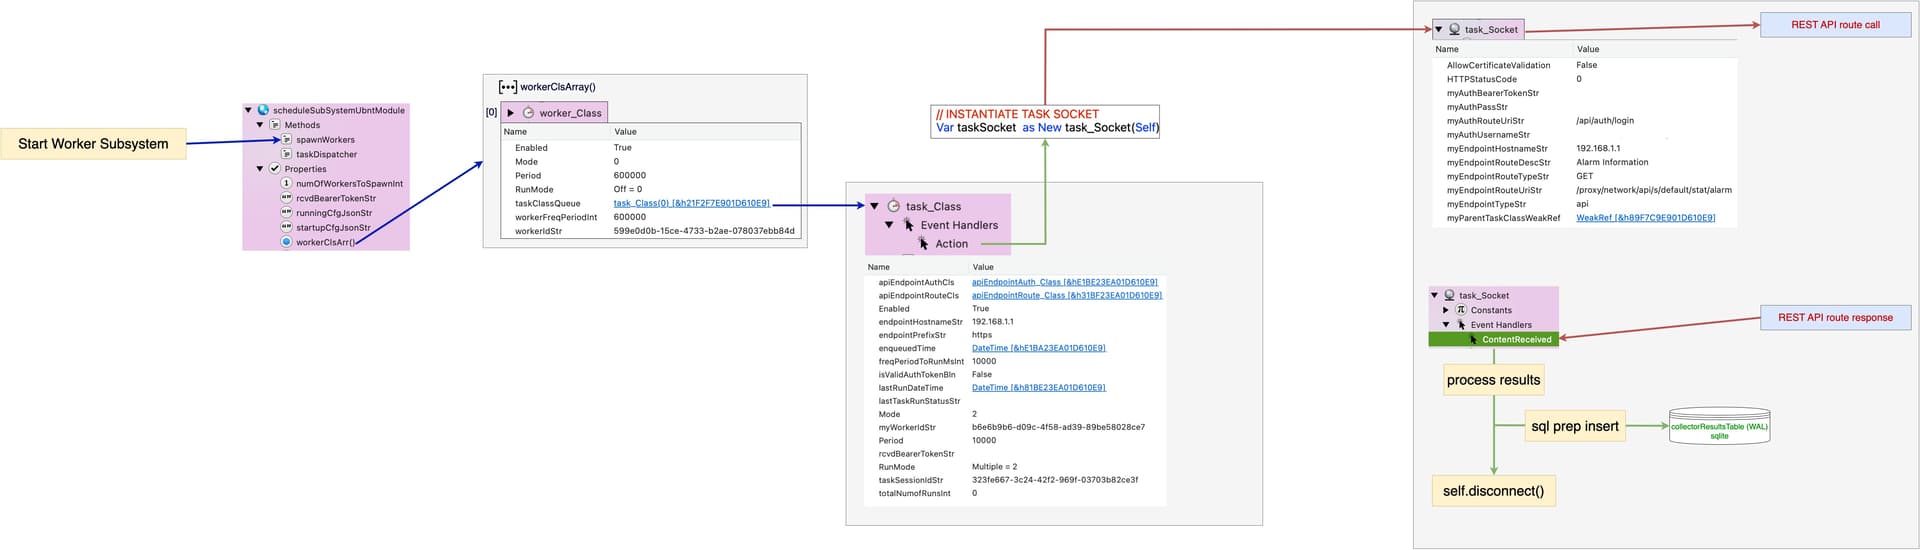
I have 4 Worker Class (subclassed from timer) running one Socket each → They make continuous API route calls and once they’ve received the results they call a sql update function to submit the JSON results to a table. The socket has a weak reference to each of their individual parent Worker classes. The socket doesn’t store the API results after the database update as I localize all variables to go out of scope when possible. I am sure I missed something because after the workers process is around the time the memory increases. I am finishing a UML of this so it will make more sense.
Thank you again
Ok if I have drawn this enough to get the idea of what I am doing here - This is where I believe my leak is coming from as this is the only area that is constantly changing.
After drawing this out all of the way it could be if the Socket’s destructor isn’t firing then potentially would I have a ton of sockets? I don’t see this on the debugger though… I see the appropriate amount of class/socket instances as above depicts in the debugger.
-
update: I added a destructor() method to the socket_class and It doesn’t fire
-
coupled with I am instantiating a new socket every taskClass timer run —> would these be stacking since they aren’t going out of scope if the destructor isn’t firing? (assuming my assumption about a destructor must fire or the socket (object) doesn’t go out of scope)
Which would suggest that something is referencing it, which remains in scope. Or that there is a reference from it to another item that has a link back to the socket. The usual cause of a memory leak.
However, you say the object count isn’t going up.
I don’t know console apps that well. Is there some state that has to be achieved before the garbage collector runs?
Right Ian, that is where I started yesterday in which i fixed this reference → The only reference I have is a weak ref from the task_socket to it’s parent task_class. I am going to take a shot and eliminate having to dynamically instantiate the socket every task_Class timer action and make this socket a property of the task_class. I will see if this stops the increase.
No change in memory consumption increases…
// INSTANTIATE TASK SOCKET
'Var taskSocket  as New task_Socket(Self)
taskSocket = New task_Socket(Self)
It still is raising around 2-4% each run and the amount of objects created hold steady on Mac OSX at 292.
Still lookin’
Are there any variables getting larger? Such as an array or string. Failure to reset them when the process completes would lead to a similar issue.
If it’s still an equal opportunity leaker, I’ve had some success in the past with instruments tracking down memory leaks in running xojo apps.
I think @Beatrix_Willius has more up-to-date knowledge on using Instruments (I haven’t used it in awhile)
Good luck!
Anthony
–
The rest of my experience probably isn’t relevant, but who knows, maybe it’ll spark a thought??
In my case, I found out xojo MySQL database objects were leaking memory (though slowly over time vs. a big jump all at once) every time I created and then destroyed one.
I fixed this by creating a pool of connections which weren’t destroyed, but just “checked out and checked in” which solved my leak problem and allowed my Web One Application to run for days without any significant change in memory usage. (hundreds of sessions per day, still <100MB after running for “many tens of days”.
I found that thread with instruments, but from what I saw it was only a desktop project unless I misunderstood that? This is a console app only.
@Anthony_Dellos thank you for that Idea though – I can run this with the SQL Insert/Update calls commented out to see if I continue to lose memory. Thanks and I will report back.