Can Xoxo charts have two separate scales for the Y axis?
My charts include two data sets with very different maximum values. One ranges up to 10,000 and the other ranges up to 100%
Can Xoxo charts have two separate scales for the Y axis?
My charts include two data sets with very different maximum values. One ranges up to 10,000 and the other ranges up to 100%
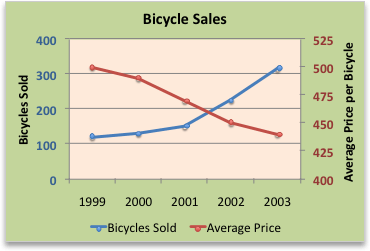
Just to make sure, you want something like this, right?

I’m not sure if Desktop Chart is based in ChartJS (it looks like Web Chart does use it). ChartJS supports that: Multi Axis Line Chart | Chart.js
Yes, that’s what I need.
My current charts look like this since everything scales to a single axis to accommodate the largest value from either dataset.
But if I disable the blue data you can see the red data has lots of useful info that doesn’t display in the combined chart.
Chart.js is not used for DesktopCharts. It is pure Xojo code. Thus the request.
Just in case : Please don’t just heart this posting. You need to click the link and thumbs up the issue.
Yes I did that too. But I also wanted to thank you for creating the feature request and posting the link here.
No problem. ![]() Just want to ensure that everyone knows this isn’t the case to upvote on
Just want to ensure that everyone knows this isn’t the case to upvote on ![]() In other words never miss out an opportunity to state the obvious.
In other words never miss out an opportunity to state the obvious.