App starts using 384 GB of virtual memory

I have a really weird problem with one user. He can’t connect to an SQLite database. I traced this back to a pragma where I reserve memory for the database. Then I noticed something odd in the startup sequence. At the very beginning - really before anything is done - I check the available memory.

The data from my Intel iMac looks like this:

2024-05-17 14:34:23 Total physical Memory: 32,000 GB
2024-05-17 14:34:23 Physical Memory used by MAX: 0,127 GB
2024-05-17 14:34:23 Free physical Memory: 0,180 GB
2024-05-17 14:34:23 Total virtual Memory: 31,910 GB
2024-05-17 14:34:23 Virtual Memory used by MAX: 6,657 GB
2024-05-17 14:34:23 Free virtual Memory: 0,180 GB

Now compare this to the M2 of the user:

2024-05-17 12:58:53 Total physical Memory: 16,000 GB
2024-05-17 12:58:53 Physical Memory used by MAX: 0,163 GB
2024-05-17 12:58:53 Free physical Memory: 0,074 GB
2024-05-17 12:58:53 Total virtual Memory: 9,681 GB
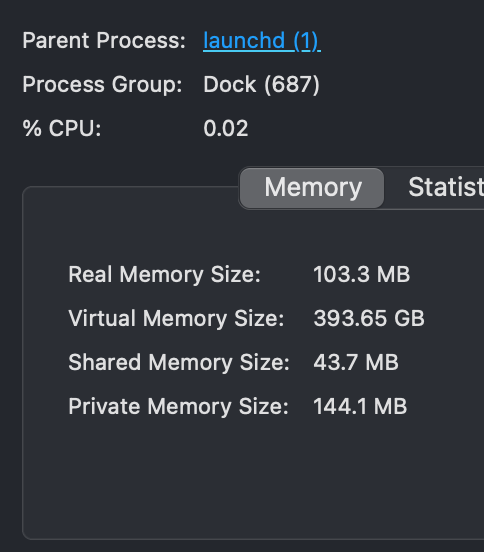
2024-05-17 12:58:53 Virtual Memory used by MAX: 394,115 GB
2024-05-17 12:58:53 Free virtual Memory: 0,074 GB

What could cause the 394 GB of virtual memory?

The code for getting the memory information, which is directly out of the MBS examples:

dim theDarwin as DarwinVMStatisticsMBS = GetDarwinVMStatisticsMBS
if theDarwin = nil then Return
dim theTaskInfo as new DarwinTaskInfoMBS
if theTaskInfo = nil then Return
dim thePageSize as Double = theDarwin.Pagesize // make a double to avoid integer overflow problems

LogItem "Total physical Memory: " + FormatMemory(SystemInformationMBS.PhysicalRAM)
LogItem "Physical Memory used by MAX: " + FormatMemory(theTaskInfo.ResidentSize)
LogItem "Free physical Memory: " + FormatMemory(thePageSize * theDarwin.FreePages)
LogItem "Total virtual Memory: " + FormatMemory(thePageSize * theDarwin.InactivePages + thePageSize * theDarwin.ActivePages + thePageSize * theDarwin.FreePages + thePageSize * theDarwin.WiredPages)
LogItem "Virtual Memory used by MAX: " + FormatMemory(theTaskInfo.VirtualSize)
LogItem "Free virtual Memory: " + FormatMemory(thePageSize * theDarwin.FreePages)

The code that fails as result:

SQLiteIndexDBMBS.ExecuteSQL "PRAGMA cache_size = 500000" // 500 MB
SQLiteIndexDBMBS.ExecuteSQL "PRAGMA encoding = ""UTF-8""" // encoding utf8 instead of utf16

I think your PRAGMA cache_size statement is wrong.
This is from the docs:
PRAGMA schema. cache_size = pages ;
PRAGMA
schema. cache_size = - kibibytes ;

So, it looks like you are allocating 500000 pages and not 500MB.

Maybe the SQLite databases on the Intel and M2 computers have different page sizes.

1 Like

As Kevin said, the negation of the value is missing

SQLiteIndexDBMBS.ExecuteSQL "PRAGMA cache_size = -500000" // 500 MB

The code for SQLite has worked at least half a dozen years. And it doesn’t explain why the virtual memory on start is so high.

Whatever the MBS plugin is doing is rather odd. I get 394 GB of virtual memory on my M1 Air, too. So I’ll try the
"PRAGMA cache_size = -500000"
next.

SQLite built into Xojo should do the same and I would have expected the Intel build to also reserve the same amount of virtual memory.

Maybe you are seeing a difference in how Intel & Apple Silicon works or possibly a SQLite issue.

For what it’s worth, I get similar results on my M1 Air as well.

  • macOS 14.5
  • MBS 24.2

I only have Mail, Safari and Xojo 2024r1.1 running with a decent size project.

Total physical Memory: 16.000 GB
Physical Memory used by MAX: 0.142 GB
Free physical Memory: 0.201 GB
Total virtual Memory: 15.045 GB
Virtual Memory used by MAX: 393.256 GB
Free virtual Memory: 0.201 GB

I don’t understand the numbers completely, but why is the calculation for line 3 & 6 the same (but with different labels)?

I’m seeing something different when using an older MBS, Xojo, and Intel builds:

Runing on Intel macOS Ventura:

Xojo: 2019r1.1
MBS: MBS Xojo Plugin 21.3 (build 20576) Sun Jul 11 08:45:12 2021 (GMT)
Target: x86
Total physical Memory: 32.00 GB
Physical Memory used by MAX: 0.03 GB
Free physical Memory: 6.67 GB
Total virtual Memory: 31.13 GB
Virtual Memory used by MAX: 33.89 GB
Free virtual Memory: 6.67 GB

Running on M1 mac (Sonoma 14.5) under Rosetta:

Xojo: 2019r1.1
MBS: MBS Xojo Plugin 21.3 (build 20576) Sun Jul 11 08:45:12 2021 (GMT)
Target: x86
Total physical Memory: 8.00 GB
Physical Memory used by MAX: 0.02 GB
Free physical Memory: 0.13 GB
Total virtual Memory: 7.45 GB
Virtual Memory used by MAX: 33.20 GB
Free virtual Memory: 0.13 GB
1 Like

On my M1 mac, if I use Activity Monitor to select a process (such as “Dock”) I also see weird VM numbers:
image

Note how “dock” claims to also be using 393GB of VM…

Seeing this on my M2 Max with no apps running.

And here’s a fresh launch of Xojo before loading a project:

Just looks like macOS on Apple Silicon is reporting the virtual memory values wrong.

Likely just using it differently, probably like how iOS does it in some way. (making use of the fast SSD to make people think its ok to have low amount of RAM)

That is just the address space, not actual pages in use.

You may ignore it.

2 Likes

This makes more sense. It’s certainly not fakery to shore up physical memory in my case. I have 33.37GB of free physical RAM right now. And I certainly am not running any app that would use 385GB of memory. It is still misleading.

Won’t this include system .dylibs that are mapped into your address space?

Good point. If I change the Build from “Universal” to “x86 64-bit”, then I get the following:

Total physical Memory: 16.000 Gb
Physical Memory used by MAX: 0.116 Gb
Free physical Memory: 0.291 Gb
Total virtual Memory: 14.968 Gb
Virtual Memory used by MAX: 34.222 Gb // ~350 less Gb of space available
Free virtual Memory: 0.291 Gb

Silicon/ARM builds are obviously handled differently. Interesting observations…

1 Like

So, it is not an SQLite issue, but a macOS ARM issue/behavior.

2 Likes