54455 - editing window not responding properly to selected error messages in debugger still not fixed

Feedback Case Number: 54455
This case was closed back in 2018 because it was not reproducible. But, it is still reproducible for me so I’ve requested it be reopened.

I’ve uploaded a screen recording movie to my Dropbox showing the problem with one of the Xojo Example projects.

I’ve changed the example to have a syntax error in three different events. After running the project, the 3 errors show appropriately but when clicking on the error the editor window gets refreshed incorrectly.

This is using the latest version of Xojo - 2021R3.1 - on a Mac running under Big Sur.

Needless to say, this same error happens in all my active projects and it is very annoying when I don’t notice it and start editing the phantom code.

Can anyone else reproduce this error or give me a clue to why it may be happening?

Can you make some instructions how to reproduce? Preferably short.

Download the example project I uploaded in the referenced Feedback case and run it. That is what I used for the video. Look for attachment named Edit_Window_Not_Refeshing.zip in the attachments for that case.

As in the video, click on the error messages you get when you try to run the project in the debugger and notice how the edit window will refresh incorrectly. Or not if you get the same result as the Xojo testing staff that could not reproduce the error.

By the way, I have no doubt this is not happening for most people, but unless someone thinks I’m photoshopping the movie, it is plain to see it is happening for me.

These x, a, and y characters that provoke the compile errors - am I right in thinking these are not artifacts but actual letters you put in in order to provoke compile errors, which then demonstrate the refresh issue?

Yes. I needed to show that the problem occurs when clicking on error messages generated by errors in the code when trying to run the debugger.

OK - in running your example, I did see one instance where when clicking on the “a” error message, I got the DropObject listing up, but with most of the lines blank. Then after about 5 seconds they filled in.

I’ve seen this myself from time to time where an editing window looks funny, as if partially filled or with previous text still there, then after a few seconds it clears. But this problem comes and goes. There is no clear pattern to it and one may go weeks without seeing it, then be plagued with it for about 15 minutes, after which it goes away again.

I don’t know how that editing pane gets refreshed when one clicks on an error message or actually on a method listed in the navigator. But then I have no info about the internals there.

Thank you!! Yes, I agree that the condition is unpredictable. That is my experience also with my other projects. But, the example I provided it happens to me the same way every time.

I requested the case be reopened, but it was not because it can’t be reproduced. This is kind of annoying to me because it implies that the problem is not really happening. I think the movie I provide proves that it is to me.

Easily reproducible here.

Mac, running Catalina
MacBook Pro 13 inch 2020 with touchbar
Xojo 2021r3.1

54455

Interesting result. I do not get the cursor acting like an eraser as it moves across the text. When I move my cursor into the edit pane, sometimes the code will completely refresh instantly - sometimes not. Thanks for showing this.

I’ve tweaked the demo project showing the bug I am experiencing. Find the new project here: https://www.dropbox.com/s/0ehp1bcioyxj56h/Code-Corruption-of-Events.zip?dl=0

Encouraged that I’m not hallucinating because some have responded that they do see what I am seeing, I’ve been looking at the situation more closely.

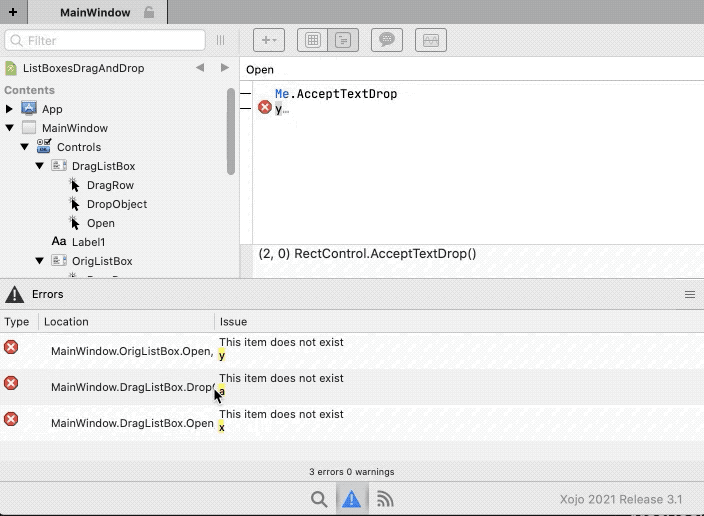
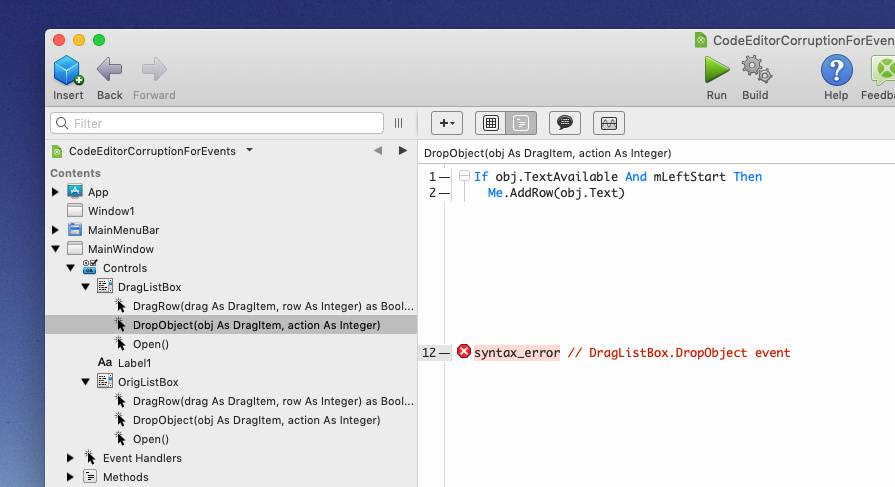
The new project has a Note item in the project describing the project and the steps needed to reproduce it. Basically, just try to run the project which will result if displaying the built in syntax errors. Go down the list of errors and note how the event code display will be corrupted. Do not click on any of the project items from the Navigator because that will never cause the corruption and will prevent you seeing the corruption from the error list.

I’ve noted the following:

• I had been focusing on clicking on the error items to display the code, but the same corrupted display of event code occurs when clicking on items in the IDE Find list.

• The editor pane always displays correctly when clicking on a list item for a method. Only clicking on items referencing event code cause the corrupted display of code.

• If there are multiple events in a project item, the first time selecting an item in the error list or find list for an event in project item, it will display correctly. Only clicking on another list item for an event inside the project item will cause the corrupted display of the code.

• While viewing a corrupted code display of an event, clicking on an event in another project item will display correctly. It seems that only when switching between different events within the same project item will you see the corrupted display. In other words, looking at the events for controls in one window and then switching to look at an event in another window clears any corruption for the display of the first event looked at.

• After seeing the corruption of event code, you can switch to looking at method code and not see corruption there. Going back to the event from the method will clear the corruption.

I have tried booting my Mac in safe mode and then opening the project. I still get the errors even in safe mode. So, I think I can rule out any extensions or login apps conflicting with Xojo. Not sure on this though.

Any suggestions for tracking down the cause of this will be welcome.

I’m getting more consistent display errors with this one. There are 12 errors listed. I can switch between the last two to provoke it consistently. Click on the last one (MainWindow.DragListBox.Open, line 2) and then the next-to-last (MainWindow.DragListBox.DropObject, line 12) to display two errors in the code window with blank space between them.

I’ve attempted to screen-shot this, but cmd-shift-3 or cmd-shift-4 typically capture the screen AS IT SHOULD BE, not what is actually displaying. I did get one partialy wrong state captured:

So then I resorted to my trusty Pentax to get this:

Which shows what it actually looked like. Moving the mouse into the coding area caused a refresh of the code area.

This is macOS Mojave, with 2021r3.1

This is what I found also. I was able to make a movie of this, but not a screen shot.

Also, if you switch out to another app or even another open project window the code pane will quickly reformat to display correctly when it loses focus.

Thanks for trying this and confirming the issue.