Could you pop your xojo and os version numbers into the ticket as well as the version numbers of the older editions you checked?
This is weird.
Mine Xojo 2022.v4.1 windows 10 , Toshiba mini pc 0% CPU.
Please don’t feel offended on this issues. We know you worked at Xojo Inc, but you don’t need to defend this. This may not be the code where you worked on.
It is very easy in Xojo projects to create circular references with timers, add handler or controls referencing their own window indirectly.
I can reproduce the issue here and stack trace of the IDE shows this method getting called:
CodeEditorCanvasNew.TypingTimerRun%%oo (in Xojo)
This timer seems to run even, when a project is closed after you worked on a project. There may be more things still running. And someone working at Xojo Inc. could check what Runtime.ObjectCount shows before you open a project and compare that to what shows after you closed a project you worked on and whether all objects get destroyed.
3 Likes
But that has nothing to do with animation as you indicated. What I was calling out was that you made a wild guess:
It’s quite possible, that Xojo starts a timer for some kind of animation and never stops it.
And then proceeded to tell them what they should do about your unfounded guess.
Should that timer be stopped when the code editor closes, absolutely. Is it solved by changing all AddressOf to WeakAddressOf, probably not. All I’m asking is that when there is an issue, that you tell Xojo what the issue is, but not how you think they should fix it.
2 Likes
Sometimes Xojo engineers can be confused thinking “inside the box” and someone say “you should see if this XYZ thing can be occurring and maybe doing WEV could fix it”. The engineer will look at the issue, find or not what’s going on, and take a look at that guess he didn’t considered at first, there he can find surprisingly exactly what the user said, or something “related” but not exact, and that hint helped to solve the issue. NEVER react at users like you do. Report back, the issue was “A” thing, not related, fixed. Or fixed, not XYZ, but related. Being a support engineer is learning humility every day, and inspecting even “possible guesses” when your list of assumptions ended. If using or not what the user said for a fix, should never be a problem. Ignoring bad guesses can be silent, reporting fixes is a duty.
7 Likes
@ChristopheDV
I’m on a MacBook Pro with an M1 Max, and I’m not seeing Xojo 2023r1.1 CPU go over 0.5% CPU when idling. Tried the following things:
- Load Xojo, close the open project window and wait, CPU drops to 0.5%
- Open a large project file, view a window in the editor and wait, CPU drops to 0.5%
- Close the project and wait, CPU drops to 0.5%
- Open the same project, view a window, wait, CPU drops to 0.5%
I’ve repeated that with the same project 5-6 times in a row. Let xojo idle and it goes to 0.5% again. All without quitting Xojo. What version are you using? Is there anything more I should try?
PS. I’m using macOS 13.4 beta 2.
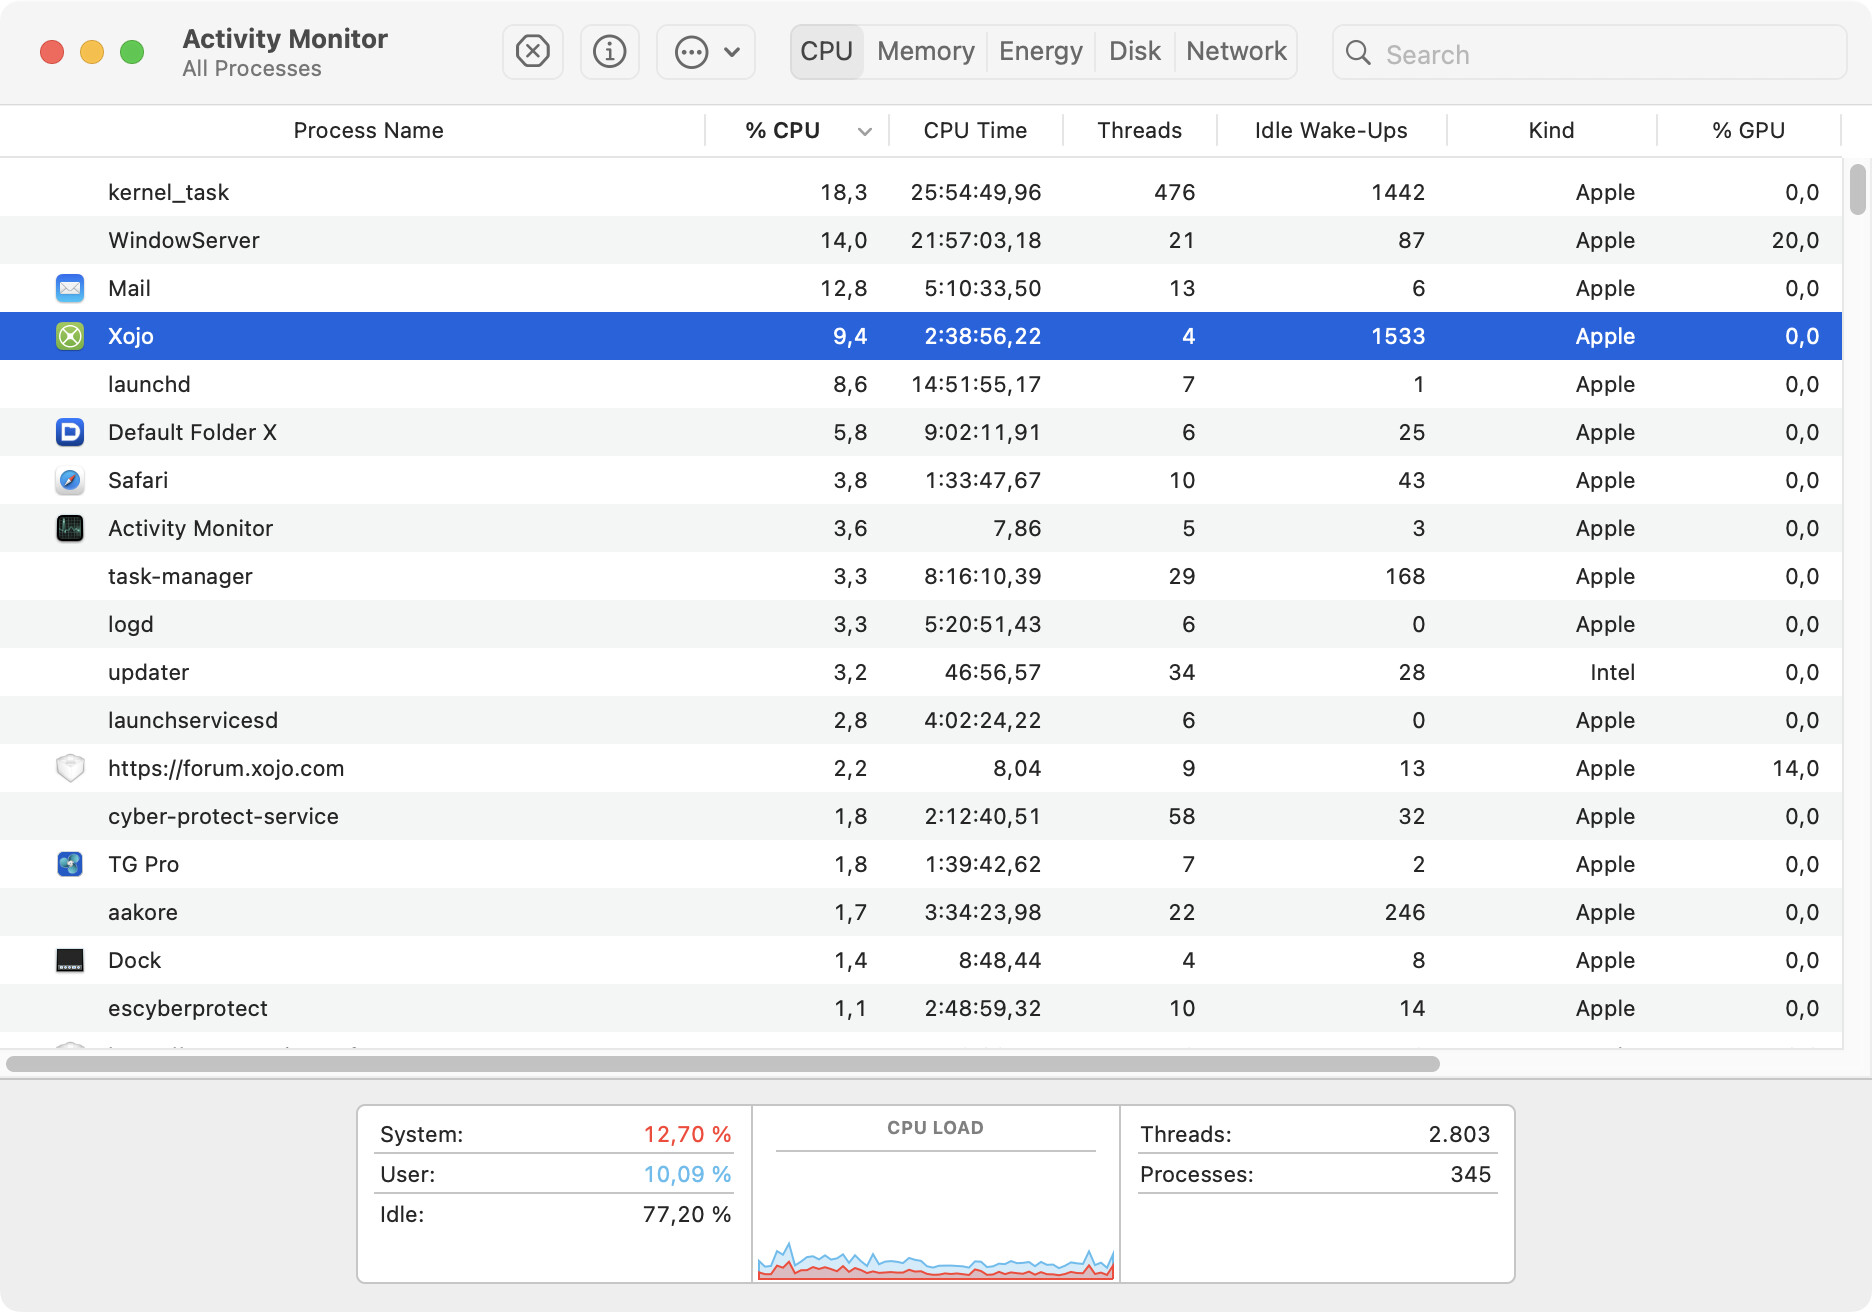
After working on a big project and closing the Window, Xojo still uses between 7 and 15% of CPU.
Seems this only happens after running the debugger at least once.
Maybe it’s somehow related to this?
https://tracker.xojo.com/xojoinc/xojo/-/issues/70571
Unfortunately still open.
The timer I saw was about typing.
So you may type something in a code editor and trigger auto complete, so the relevant timer starts.
The timer is not the problem, but that the timer remains after the window is closed.
For that we used to put code in a timer Action event to check if ControlCount = 0. because when the window is closed, the controls are gone and then the timer can disable itself.
But if it was just that, would the CPU consumption really be that high?
Jérémie seems to have found another lead too :
After working on a big project and closing the Window, Xojo still uses between 7 and 15% of CPU.
Seems this only happens after running the debugger at least once.
Edit : it was a response to Christian.
on my MacBook M2 about 5%, so same thing could be 10% on a slower machine. Also if it happens for each project you open, you may collect multiple timers and thus need more CPU usage.
Simply opening a project, typing something in code editor, saving and closing: 0.5 % CPU
after first debug run: 1.2 % CPU with 3 Threads
after four debug runs: 2.5 % CPU with 3 Threads (had to wait a moment to see threads close and CPU useage go down).
After a day of dozens of debug runs: round about 6 - 8 % CPU
Looks like there is something small left over after a debug run…
(tested with macOS 12.6.5, Xojo 2023R1.1, 61 plugins loaded, MacStudio M1 Pro with 64 GB RAM, small/mid-size project)
5-10% of a powerful CPU for a timer? and it doesn’t do anything anymore? (users here say that the CPU consumption continues after the project is closed)
In my mind, timers used to consume very little resources, I’m surprised. :o(
1 Like
We don’t know what the timer does or how often it runs. But yes, it looks like a timer is a problem:
! : | + 1 CodeEditorCanvasNew.TypingTimerRun%%o<CodeEditorCanvasNew>o<Timer> (in Xojo) + 21 [0x116de2575]
! : | + ! 1 RuntimeLockObject (in XojoFramework) + 17 [0x119db78d6]! : | + 1 CodeEditorCanvasNew.TypingTimerRun%%o<CodeEditorCanvasNew>o<Timer> (in Xojo) + 34 [0x116de2582]! : | + ! 1 RuntimeStackCheck (in XojoFramework) + 113 [0x119dc38e4]! : | + ! 1 StackContext::framePtr() const (in XojoFramework) + 57 [0x119e0617b]! : | + ! 1 unw_init_local (in libunwind.dylib) + 104 [0x7fff6b71bb2b]! : | + ! 1 libunwind::UnwindCursor<libunwind::LocalAddressSpace, libunwind::Registers_x86_64>::setInfoBasedOnIPRegister(bool) (in libunwind.dylib) + 117 [0x7fff6b71bbab]! : | + ! 1 libunwind::UnwindCursor<libunwind::LocalAddressSpace, libunwind::Registers_x86_64>::getInfoFromCompactEncodingSection(unsigned long long, unsigned long long, unsigned long long) (in libunwind.dylib) + 308 [0x7fff6b71c004]! : | + 1 CodeEditorCanvasNew.TypingTimerRun%%o<CodeEditorCanvasNew>o<Timer> (in Xojo) + 65 [0x116de25a1]! : | 1 ??? (in XojoFramework) load address 0x119b4d000 + 0x26ffee [0x119dbcfee]! : | + 1 ClassDeclBase::FindEventHandler(RuntimeObject*, char const*) const (in XojoFramework) + 78 [0x119c37710]! : | + 1 strcasecmp (in libsystem_c.dylib) + 20 [0x7fff6b48015b]! : | 1 ??? (in XojoFramework) load address 0x119b4d000 + 0x27001b [0x119dbd01b]! : | 1 AutoreleasePool::~AutoreleasePool() (in XojoFramework) + 20 [0x119ca9af0]! : | 1 -[NSAutoreleasePool release] (in Foundation) + 144 [0x7fff45678b56]! : | 1 _CFAutoreleasePoolPop (in CoreFoundation) + 22 [0x7fff4353ba06]! : | 1 objc_autoreleasePoolPop (in libobjc.A.dylib) + 0 [0x7fff6a7b2d4b]! : 1 __CFRunLoopDoTimer (in CoreFoundation) + 105 [0x7fff435858a9]
OK, I’ve run and quit my application 8 times now and the baseline usage has gone from 0.5% to 0.7-0.9%. Threads seem to be bobbling between 3 and 4, which is something of a confirmation at least.
Deleting the last letter of a method and then pressing tab to autocomplete it 30 time or so has pushed it another 0.1% to a minimum of 0.8%.
Closing the project and leaving Xojo running results in the steady 0.9-1.0% reading.
While I do see numbers rise to the 9% mark after running the app, they drop again after quitting for me after about 10-20 seconds of watching Activity Monitor. I’m seeing peaks with actual activity but only a small rise in the baseline. That said there’s certainly something there. I’ve signed onto the bug report.
2 posts were split to a new topic: Minimize Child Windows with Parent
It looks I have the exact same problem on my iMac 5K Intel
I’m using Xojo 2022R1
I can assume that this is known by the creators of Xojo and can be resolved quickly?
Have you looked at this Issue ? This is now marked as Closed. The fix will appear in a future release, as always.
1 Like
Good to hear!