You don’t understand the problem.
In the paintevent i scroll with the mousemove through an array and calculate / display the values. That’s easy.
To link that values with a stretched, zoomed, shifted and scrolled picture IS UGLY!!!
If the values under the line and the identical position in the stretched picture are not ABSOLUTE precise my customers will complain.
At the moment i think to draw a line with Xojo is a rocketsience!
Hi Peter, how much milliseconds does your graph take to draw? Have you measured it? If it‘s under 16/30 ms I see no problem to draw a few lines in the same paint event every mouse move.
You should only invalidate the area (rect) of the canvas that needs to be repainted.
You are asking for an easy button and we’re telling you there is no easy button. You are gonna have to do the work in the paint event. There are ways to make the paint event fast, very fast, but you’re gonna have to learn the techniques to do so.
Or, hire a consultant to do it for you or teach you how to do it. Depends on how much time and effort you can afford to put into it to do it the right way in Xojo.
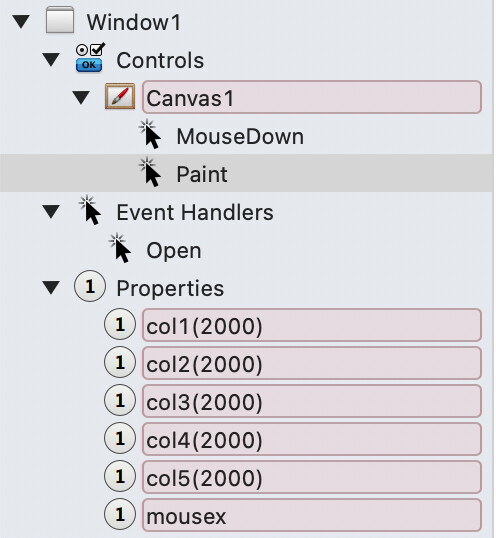
In the Open event of the window, I fill those arrays with dummy data to simulate yours:
(This is all API1 syntax)
col1(0) = 30
col2(0) = 200
col3(0) = 130
col4(0) = 330
col5(0) = 20

dim y as integer
for x as integer = 1 to 2000
  y= (rnd * 10) -5
  col1(x) = col1(x-1) + y
  y= (rnd * 10) -5
  col2(x) = col2(x-1) + y
  y= (rnd * 10) -5
  col3(x) = col3(x-1) + y
  y= (rnd * 10) -5
  col4(x) = col4(x-1) + y
  y= (rnd * 10) -5
  col5(x) = col5(x-1) + y
next

//now we have a series of points
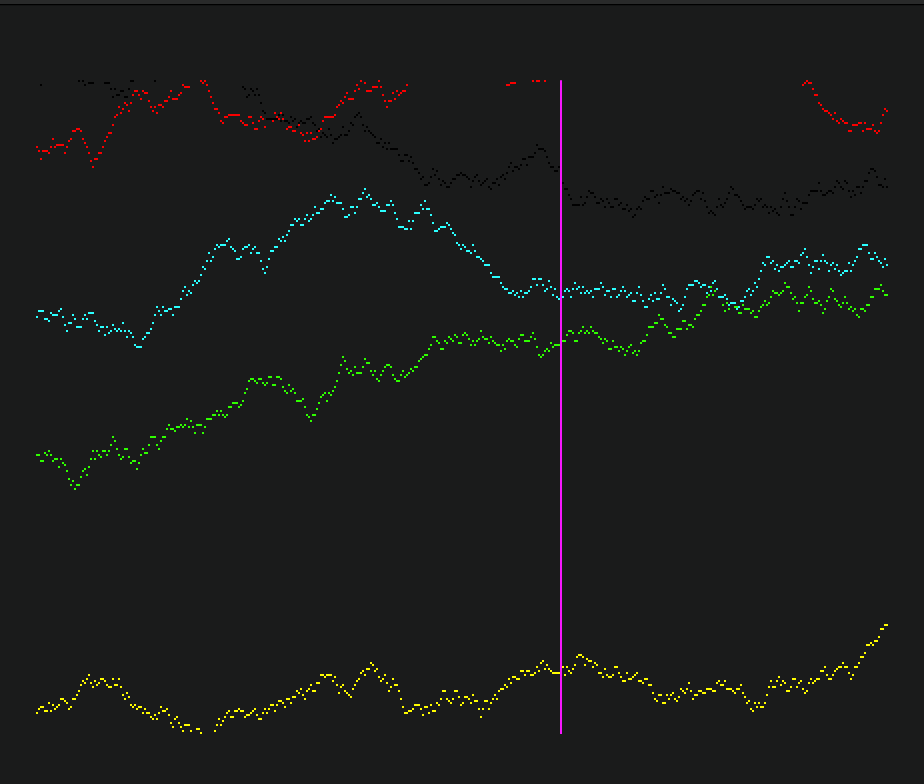
In the canvas paint event, I plot those using pixel. It would be better done using connecting lines, I expect.
I havent checked the edge conditions of the array, so I wrapped each in a try catch
dim startpoint as integer = 30 //for example
for x as integer = 0 to me.width    //can only draw as many pixels as we can see
  try
    g.pixel(x,col1(x+startpoint)) = &cff0000 //red
  catch
  end try
  try
    g.pixel(x,col2(x+startpoint)) = &c00ff00 //green
  catch
  end try
  try
    g.pixel(x,col3(x+startpoint)) = &c00ffff
  catch
  end try
  try
    g.pixel(x,col4(x+startpoint)) = &cffff00
  catch
  end try
  try
    g.pixel(x,col5(x+startpoint)) = &c000000
  catch
  end try
next

//now a line where the mouse is
g.forecolor = &cff00ff
g.drawline  mousex,0,mousex,g.height
and in the mousedown event, I set the mousex value and invalidate the canvas to cause a repaint
When the user zooms or scrolls, you need to rebuild the picture. But at least the mousemove repaint will be fast. You only need to draw the graph when the viewport changes.
Thanks Jeff for your help!
In the paint event after drawing of the chart there is the drawline mousex …
But in the mousedown.event the whole chart and line is redrawn
The me.invalidate has the same effect like refresh. I tried that.
For me it is no possible to draw the chart once and draw the line wherever i want without destroying the chart.
But i found a problem with invalidate.
If a mousemove event exists (empty!) it fires a paint event!
Yes it is.
Add a picture property to the window.
Initialise it to the same size as the canvas.
Draw the charts into the graphics of the Picture once.
Then invalidate the canvas
If the zoom / pan/ scale is changed, draw the charts into the graphics of the Picture again, and invalidate the canvas
In the canvas paint event, use .drawpicture to show what the picture contains, and then use .drawline to draw the indicator line on top of it.
When the mouse position changes, invalidate the canvas. The picture has not changed and does not contain ‘the line’, so you just paint it again, and draw a new line in the new place.
But i found a problem with invalidate.
If a mousemove event exists (empty!) it fires a paint event!
Not a problem if you have recorded the last x position of the mouse relative to the canvas. (mousex above)
BTW: I think you don’t want mousemove.
I think you want mousedrag, which fires when the mouse is held down and moved.
Thank you Jeff, i think i have to go that way.
On Linux i have x charts on x canvas with a line-canvas with mousemove on top.
The canvas can be visible or not. So the selected chart is visible or not.
The shown values are always precise. It’s easy to understand and maintain.
Nothing flickers. It works PERFECT!!!
But not on Windows! XOJO drives me mad. I have to redesign my app again…
Und bei allen Andern möchte ich mich auch für die Hilfe bedanken.
Allerdings ist der Google Translator oft auch keine große Hilfe, da die Übersetzungen des Originaltextes oft nicht sachlich korrekt sind. Ebenso ist die Xojo-Hilfe (dreifach vorhanden als: veraltet, aktuell und neu) stellenweise sehr lückenhaft. Das alles zu übersetzen macht es für Anfänger wirklich nicht leicht. Trotzdem Danke an Alle!