Hi,
Has anyone attempted to read and display pdb files in Xojo?
What would a reasonable starting point be to implement something like this?
Thanks
Markus
Hi,
Has anyone attempted to read and display pdb files in Xojo?
What would a reasonable starting point be to implement something like this?
Thanks
Markus
What are PDB files used for Markus?
Pdb = protein data base
3D structures of proteins as well as DNA, small molecules etc
See for example http://pdb.org/pdb/home/home.do
P.S. I’m starting with simple needs.
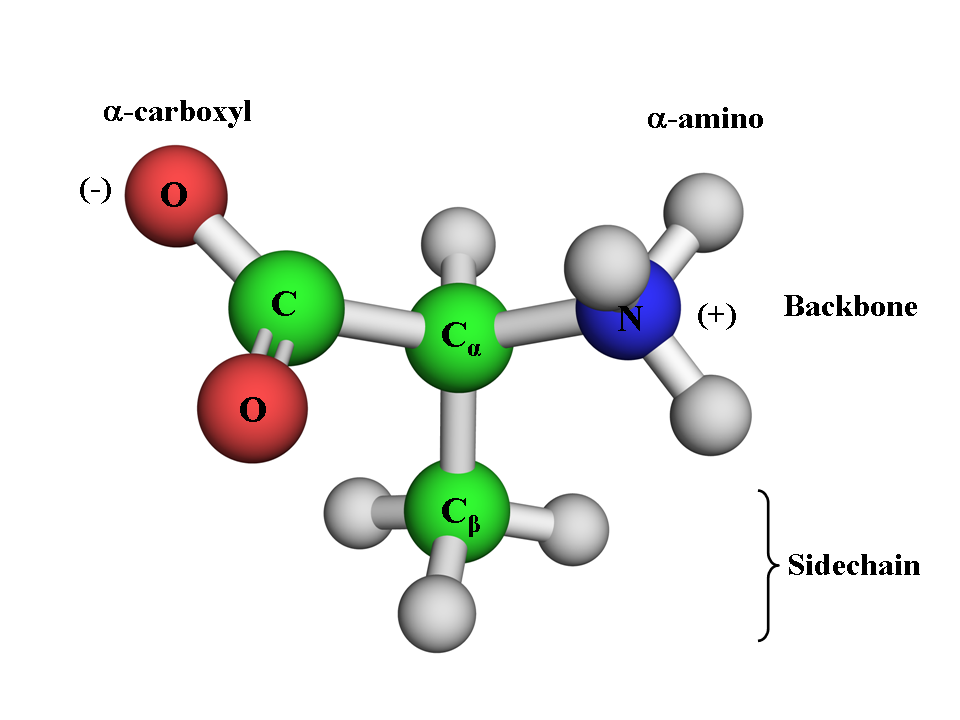
At the moment I show pictures of amino acid structures. Would be nice if the user could use 3D models instead.
Proteins are for the future 
Is it fair to say that an amino acid structure might look something like this?

I’m just asking because I didn’t have biology as a subject at school, so just trying to understand what your rendering needs might be.
Pretty much. That seems to be a DNA base but amino acids are not much more complex . Actually often less.
What do you want to do? What aspects are you unsure about?
I love the PDB because many hard-core science datas are either behind a pay wall, edu only, hard to get at or hard to parse (imo) but PDB is just the opposite. The format is just a text file where each line starts with a ‘record’ type followed by it’s data. Each type has a definition of the start and end bytes of each data column. You can treat it as ascii and just pull out those parts you need. For example this is the definition for a line that starts ATOM…
1 - 6 Record name "ATOM "
7 - 11 Integer serial Atom serial number.
13 - 16 Atom name Atom name.
17 Character altLoc Alternate location indicator.
18 - 20 Residue name resName Residue name.
22 Character chainID Chain identifier.
23 - 26 Integer resSeq Residue sequence number.
27 AChar iCode Code for insertion of residues.
31 - 38 Real(8.3) x Orthogonal coordinates for X in Angstroms.
39 - 46 Real(8.3) y Orthogonal coordinates for Y in Angstroms.
47 - 54 Real(8.3) z Orthogonal coordinates for Z in Angstroms.
55 - 60 Real(6.2) occupancy Occupancy.
61 - 66 Real(6.2) tempFactor Temperature factor.
77 - 78 LString(2) element Element symbol, right-justified.
79 - 80 LString(2) charge Charge on the atom.[/code]
and an example of ATOM records with field columns marked out as alternating | -.
12345678901234567890123456789012345678901234567890123456789012345678901234567890
||||||-----|||||-||||-||||-   ||||||||--------||||||||------||||||          --||
ATOM      1  N   MET A   1       8.751  22.246  41.614  1.00 26.15           N
ATOM      2  CA  MET A   1       8.643  21.115  40.743  1.00 25.22           C
ATOM      3  C   MET A   1       7.406  21.559  39.976  1.00 26.20           C
ATOM      4  O   MET A   1       6.474  22.085  40.596  1.00 27.93           O
All the record formats are here http://www.wwpdb.org/documentation/format33/v3.3.html along with a straightforward Introduction, or you can get the pdb xml and mmCIF formats here http://www.rcsb.org/pdb/static.do?p=file_formats/index.jsp
I’ve never tried parsing all the data because it’s very easy to skip over and just get what you want. To be practical though you’ll probably want to parse it enough to group things into a tree of Classes like Complex > Molecule > Chain > Residue > Atom. There can also be water atoms and other tertiary datas and NMR files contain 20 or so versions of the same molecule wiggling about. So depending what you want to do determines how much you’ll need to parse.
I swear I’ve seen someone post a project with a hierachical listbox showing chains and things but I can’t find it. Only this crude project of mine that simply collects ATOM XYZ info (I think done as a test of how fast I could do it). I don’t know if it’ll run but this slightly trimmed piece is the meat of it, open a pdb file and fill up the vertsX/Y/Z() As single arrays, and cols() As Color based on the atoms element.
[code]Sub Action() //OpenButton
//open a pdf file to a TextInputStream
dim f As FolderItem = GetOpenFolderItem(“”)
if f = nil then return
dim tis As TextInputStream = TextInputStream.Open(f)
//read through all lines saving only interested types to sa()
dim s, s4, sa() As String
while not tis.EOF
s = tis.ReadLine
s4 = s.LeftB(4)
if s4 = “ATOM” then 'or s4 = "TER " then
sa.Append s
end
wend
//scan sa() extracting XYZ and element info
dim last As integer = sa.Ubound
for i As integer = 0 to last
s = sa(i)
vertsX.Append Val(s.MidB(31, 8))
vertsY.Append Val(s.MidB(39, 8))
vertsZ.Append Val(s.MidB(47, 8))

select case s.MidB(78, 1)
case "N"
  cols.Append &c0000FF
case "C"
  cols.Append &c808080
else
  cols.Append &c333333
end
next
centerVerts
display.Invalidate
End Sub[/code]
For drawing there’s OpenGL, but filled circles in a Canvas can give a pretty good effect. Again it depends what you’re after. Maybe the RCSBs online viewer can be used through a HTMLViewer http://www.rcsb.org/pdb/explore/jmol.do?structureId=4IHX&view=symmetry&bionumber=1.
Hi Will,
thanks for all the info!
Pretty much everything as I’ve never done anything with 3D. I have “heard” of OpenGL but that is pretty much it.
At the moment it is just an idea. In an old app of mine I display some amino acid properties including a picture

and I thought it would be cool if the user could rotate it round to get a better idea of how it looks.
So at the moment I’m just trying to get an idea on how one would do it, what is involved, and then decide on wether it is beyond me for the time being or too much effort for the benefit it brings anyway.
I’ve written a few tutorials on OpenGL 3D rendering with Xojo if you are interested. It should give you enough information and practical examples to get started with 3D programming.
Thanks Alwyn, I will have a look at them.
Let me know if you have any questions, and I will try to help where I can.
I know Eugene Dakin also wrote a very nice book on OpenGL programming with Xojo, that I would recommend if you want a deeper understanding of OpenGL.