What's is wrong with my chart?

DesktopChart

Code:

Var colors() As ColorGroup = Array(new colorgroup(&c77c0e8, color.red), new ColorGroup(&c261174, color.orange), new colorGroup(&c399c86, color.yellow), new colorgroup(&cd4c364, color.white), new colorgroup(&c982c86, color.Purple), new ColorGroup(&c146726, color.blue), new ColorGroup(&c868927, color.gray))

Chart1.Title = “”
Chart1.Mode = DesktopChart.modes.bar
Chart1.GridColor = Color.Clear
Chart1.TitleFontName = FontNameDefault
Chart1.TitleFontSize = FontSizeDefault

Var data2() As Double = Array(RetornaValor(pwin1.Text),RetornaValor(pwin2.Text), RetornaValor(pwin3.Text), RetornaValor(pwin4.Text), RetornaValor(pwin5.Text), RetornaValor(pwin6.Text), RetornaValor(pwin7.Text), RetornaValor(pwin8.Text))

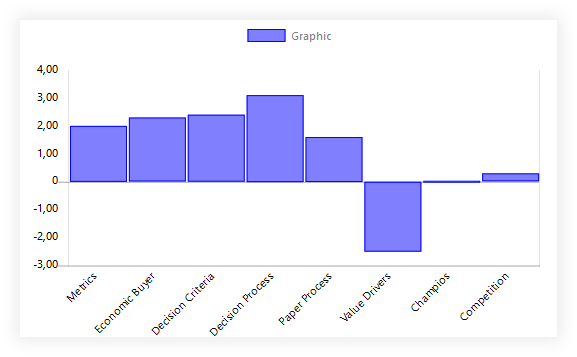
Chart1.AddLabels Array(“Metrics”, “Economic Buyer”, “Decision Criteria”, “Decision Process”, “Paper Process”, “Value Drivers”, “Champios”, “Competition”)

Var mySet As New ChartLinearDataset(“Graphic”, Color.Blue, True, data2)
mySet.ChartType = ChartLinearDataset.ChartTypes.bar
Chart1.AddDatasets(mySet)

Your code displayed as Xojo Code:

Var colors() As ColorGroup = Array(New colorgroup(&c77c0e8, Color.red), New ColorGroup(&c261174, Color.orange), New colorGroup(&c399c86, Color.yellow), New colorgroup(&cd4c364, Color.white), New colorgroup(&c982c86, Color.Purple), New ColorGroup(&c146726, Color.blue), New ColorGroup(&c868927, Color.gray))

Chart1.Title = ""
Chart1.Mode = DesktopChart.modes.bar
Chart1.GridColor = Color.Clear
Chart1.TitleFontName = FontNameDefault
Chart1.TitleFontSize = FontSizeDefault

Var data2() As Double = Array(RetornaValor(pwin1.Text),RetornaValor(pwin2.Text), RetornaValor(pwin3.Text), RetornaValor(pwin4.Text), RetornaValor(pwin5.Text), RetornaValor(pwin6.Text), RetornaValor(pwin7.Text), RetornaValor(pwin8.Text))

Chart1.AddLabels Array("Metrics", "Economic Buyer", "Decision Criteria", "Decision Process", "Paper Process", "Value Drivers", "Champios", "Competition")

Var mySet As New ChartLinearDataset("Graphic", Color.Blue, True, data2)
mySet.ChartType = ChartLinearDataset.ChartTypes.bar
Chart1.AddDatasets(mySet)

The code does not compile… FontNameDefault, FontSizeDefault, etc. are unknow.

Can’t you share a project that runs ?
(drop it as zip file into the forum page)

To answer your title: Nothing.
I can just assume that your RetornaValor Method, does not return Doubles…

See here. I just replaced your RetornaValor(…) values with double values:

Var colors() As ColorGroup = Array ( New colorgroup( &c77c0e8, Color.red ), New ColorGroup( &c261174, Color.orange ), New colorGroup( &c399c86, Color.yellow ), New colorgroup( &cd4c364, Color.white ), New colorgroup( &c982c86, Color.Purple ), New ColorGroup( &c146726, Color.blue ), New ColorGroup( &c868927, Color.gray ) )

Chart1.Title = ""
Chart1.Mode = DesktopChart.modes.bar
Chart1.GridColor = Color.Clear
Chart1.TitleFontName = "Helvetica"
Chart1.TitleFontSize = 16

Var data2() As Double = Array ( 2.0, 2.3 , 2.4 , 3.1 , 1.6 , -2.5 , 0.0 , 0.3 )

Chart1.AddLabels Array ( "Metrics", "Economic Buyer", "Decision Criteria", "Decision Process", "Paper Process", "Value Drivers", "Champios", "Competition" )

Var mySet As New ChartLinearDataset( "Graphic", Color.Blue, True, data2 )
mySet.ChartType = ChartLinearDataset.ChartTypes.bar
Chart1.AddDatasets(mySet)

and this is the result:

(For future posts, i’d recommend you give us more context. Like Xojo Version, Operating System and/or Type of Project, Error Messages, etc. … :wink:

2 Likes

I’m running 2024 r4.2 in a Mac OS 26.1 .

The problem was the size of the chart.