Yes, it is old, but the answer seems to be this valid. chartjs is not able to do localization (and apparently there are no plans either), as there are too many localizations. But as shown above they have implemented callback functions. Look at them as being kind of “webhooks” allowing you to inject your own JS routines. In such a callback you can for instance convert the number in the label to string(locale). I made this work on my own chartjs implementation.
But the issue is that we (Xojo users) don’t have direct access to chart.js. We only have this OverrideOptions event which does what its name implies. You can override options but I have no idea how we could be able to implement a callback in this event. Unfortunately, localization is important.Every customer will tell you “Perfectly done Jeannot, but now replace this dot with a comma please, or did you not pay attention at school” ;-). Now tell your customer that changing a dot to a comma is not possible and you are instantly in a big debate …
Done via a webchart and the following code in the respective events of the webChart
Opening Event:
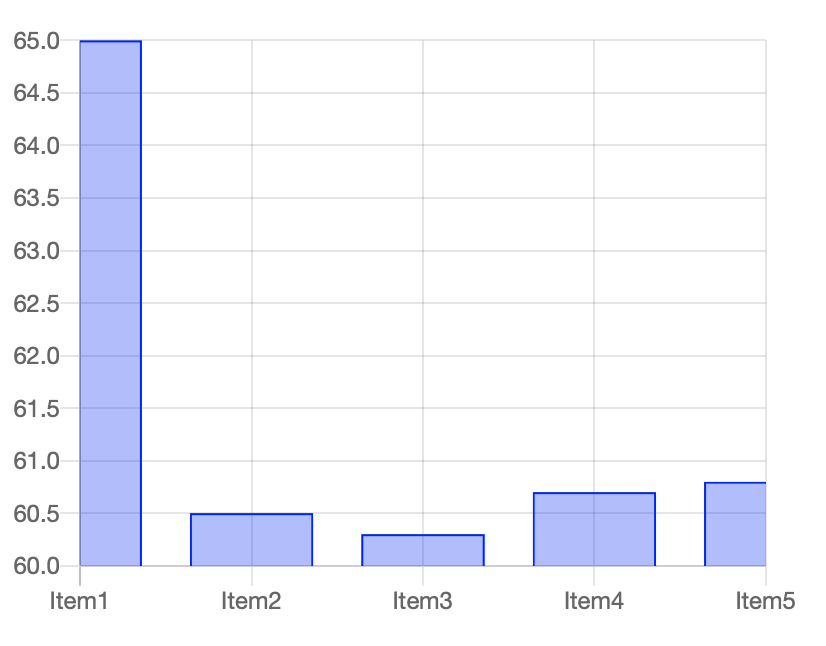
    Var data() as double = Array(65.0,60.5,60.3,60.7,60.8)
    var labels() as string = Array("Item1","Item2","Item3","Item4","Item5")
    Var teccSet As New WebChartLinearDataset("Free in %", &c0000ff, true, data)
    teccSet.ChartType = WebChartLinearDataset.ChartTypes.Bar
    me.AddDataset( teccSet )
    me.AddLabels( labels )
OverrideOptions Event:
var injectionValue as new jsonItem
var injectionTicks as new jsonItem
var injectionyAxes as new jsonItem
var injectionScales as new jsonItem

injectionValue.value("min") = 0
injectionValue.value("max") = 100
injectionValue.value("beginAtZero") = true

injectionTicks.value("ticks") = injectionValue
injectionyAxes.value("yAxes") = injectionTicks
'injectionScales.value("scales") = injectionyAxes

options.value("scales") = injectionyAxes
'options.value("options") = injectionScales
None of this works, but according to the documentation it should … Webcharts Localization not possible? … But it is 2 am over here, I probably overlooked something.
yeah, there are many callbacks documented, but I have no idea how I can implement this w/o a custom control (probably not at all). All what the OverrideOptions Event offers is a jsonITEM Object :-(.
There is an example on that page in JavaScript that shows you what it should look like. I’ve not done anything with charts in Web 2.0 yet, so I can’t be of more help than to say: It doesn’t look like you’re passing a JavaScript function to the callback option.
That’s true ;-), but I’m meanwhile only trying to set the yAxe to a fix minimum and maximum. As you can see in my above picture it currently starts at the lowest value in my data array. According to the documentation of chartjs we can change that behavior. According to @Greg_O_Lone we can use this override event for that purpose, but it already fails at this level … well I should probably say: I’m failing :-).
Having an influence on the axes would be great too. You should really try it BTW, it’s done very nicely and easy to get beautiful results, which look really nice on Retina.
I use my own charting solution based on ChartJS, GraffitiWebChart, in Web 1.0. Haven’t decided what I’m doing for Web 2.0 yet, but I’ve been considering alternatives to ChartJS for quite a while.
The Code in the OverrideOptions Event looks now like this:
var injectionTitleChild as new jsonItem
var injectionTitle as new jsonItem
injectionTitleChild.value("display") = true
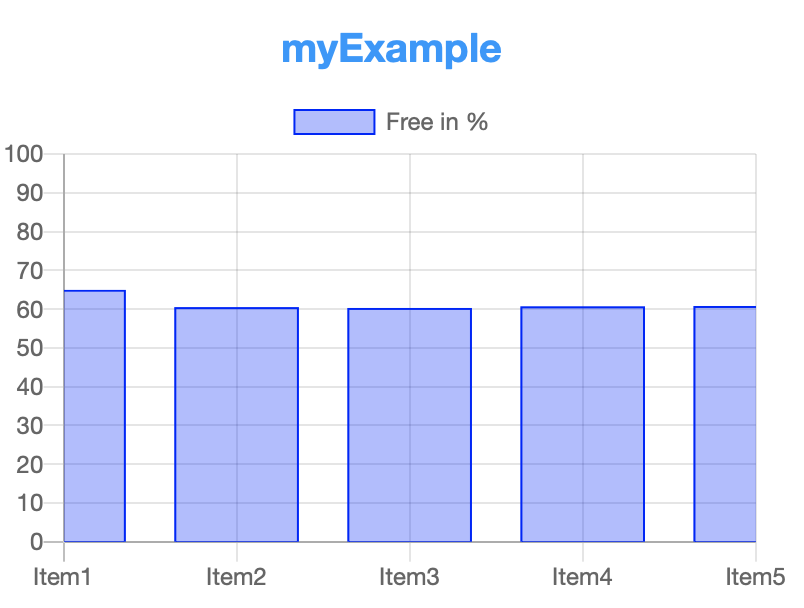
injectionTitleChild.value("text") = "myExample"
injectionTitleChild.value("fontSize") = 20
injectionTitleChild.value("fontColor") = "#0096ff"
options.value("title") = injectionTitleChild
var injectionValue as new jsonItem
var injectionTicks as new jsonItem
var injectionyAxes as new jsonItem
var injectionScales as new jsonItem
injectionValue.value("min") = 0
injectionValue.value("max") = 100
injectionValue.value("stepSize") = 10
injectionTicks.value("ticks") = injectionValue
injectionyAxes.add injectionTicks
injectionScales.value("yAxes") = injectionyAxes
options.value("scales") = injectionScales
This can be kind of a workaround for my particular requirement, as enforcing the percentage yScale to go from 0 to 100 will overrule the doubles with decimal delimiter when the values are very clode and chartjs is “deciding” with scale to use best.
Now off to inject some Callbacks. I’m optimistic that I will be able to inject the callback, but nor sure yet how to make my own JavaScript available to DOM.
var injectionTitleChild as new jsonItem
var injectionTitle as new jsonItem

injectionTitleChild.value("display") = true
injectionTitleChild.value("text") = "myExample"
injectionTitleChild.value("fontSize") = 20
injectionTitleChild.value("fontColor") = "#0096ff"
options.value("title") = injectionTitleChild


var injectionValue as new jsonItem
var injectionTicks as new jsonItem
var injectionyAxes as new jsonItem
var injectionScales as new jsonItem

'injectionValue.value("min") = 0
'injectionValue.value("max") = 100
'injectionValue.value("stepSize") = 10
'injectionValue.value("beginAtZero") = false
injectionValue.value("callback") = "function(value, index, values) { return '$' + value; }"
injectionTicks.value("ticks") = injectionValue
injectionyAxes.add injectionTicks
injectionScales.value("yAxes") = injectionyAxes


var interim as string = injectionScales.ToString

options.value("scales") = injectionScales
It is valid JSON, looks the same than in standalone use of chartjs.org in pure HTML.
If the code would run, a simple.
return value.toLocaleString("de-DE");
would solve my issue. At least it does in the pure HTML / JS combo.
@Greg_O_Lone
I suppose you are not allowing to run JavaScript, meaning callbacks? At least I learned many other things one can do with the WebChart :-). I have still a bit of hope, as it is doing “something”, breaking the rest of the code …
OK, I used @Jeannot_Muller OverrideOptions code as a starting point:
var injectionTitleChild as new jsonItem
var injectionTitle as new jsonItem

injectionTitleChild.value("display") = true
injectionTitleChild.value("text") = "myExample"
injectionTitleChild.value("fontSize") = 20
injectionTitleChild.value("fontColor") = "#0096ff"
options.value("title") = injectionTitleChild


var injectionValue as new jsonItem
var injectionTicks as new jsonItem
var injectionyAxes as new jsonItem
var injectionScales as new jsonItem

injectionValue.value("stepSize") = 0.5
injectionValue.value("beginAtZero") = false
injectionTicks.value("ticks") = injectionValue
injectionyAxes.add injectionTicks
injectionScales.value("yAxes") = injectionyAxes


var interim as string = injectionScales.ToString

options.value("scales") = injectionScales
Then put the following in the Shown event of the chart:
I’m not a good developer for JS so I have some problem to take the code JS in the stackoverflow example and put it in the Xojo string for the executionjavascript.