not 100% sure there’s a one to one mapping
one handle could be referring to a container control or window which then has many objects in the Xojo runtime
but there should be at least 1 matching xojo object
If the UserObject is not going down, it means that you keep a reference to an object you no longer use. That is the leak. Maybe some Circular References.
Maybe this could help:
http://documentation.xojo.com/topics/advanced_features/creating_weak_references_to_objects.html
I just added 200 screens (4 controls per screen, container, two labels and a canvas), 1346 controls, 685 handles and no crash. Unless you have a specific reproduction route, nothing I can do will increase those numbers which would indicate a leak of some kind.
I created a Windows app as a test. It has one window and one push button on that window. No code whatsoever. Even that has 100 handles, 26 User Objects and 58 GDI objects.
That surprised me.
I wouldn’t worry about those numbers, that’s the cost of spinning up an app in xojo  e.g. my current open xojo feedback app has 1677 handles and 1139 user objects.
When you see the message “The current process has used all of its system allowance of handles for Window Manager objects.” is your app still running or does it close down then show the error? What I’m getting at is are you able to see it on the taskmanager list and check its userobject/handle count when this problem happens?
Without seeing your code, I’d check things that could cause recursion which could cause a run away of timers/windows/controls where you keep creating them when you don’t realise you are. As I mentioned, I tried you app, went with 200 screens, double that you could cause issues with and I didn’t have any problems so its not just that. Maybe you’re trapping an error, popping up a message window and causing a similar error again which will quickly cause hundreds of popups to occur and cause a lack of resource error.
Julian,
Thanks for the info. When the error happens I don’t get any messages. The whole thing just freezes but I can see I’ve hit the 10,000 object limit in Task Manager.
The fact that you were able to load up 200 items and I couldn’t actually helps me! I’m going to email you to get the database file where I store everything. I want to try running here with your file.
Maybe testing with this:
https://forum.xojo.com/45314-xojo-instruments-diagnostic-tool-for-memory-leaks-and-circular-
Thanks everyone for the help! I figured out the problem. Thanks to Julian for doing some testing with me and helping me find a different unknown bug as well!
The problem was not memory leaks or circular references. I was using WeakRefs for any object that is in more than one place and it couldn’t be a memory leak since the problem happened right on startup, etc.
My system is controlling a video matrix. There’s X number of TV screens in the matrix and Y number of video sources. In the app, when you click on one of the screens, you get a menu of the available video sources and then you select which one you want to view:
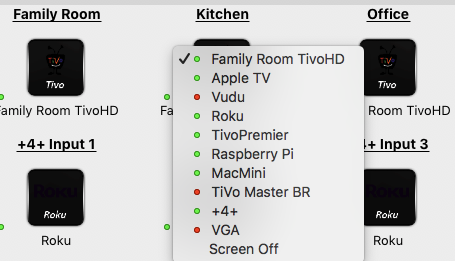
What pointed me in the right direction was Julian tried loading up my app with 200 controls loaded on the main screen, it loaded fine for him. What he didn’t do is load up a lot of video sources. I then picked up where Julian had left off and started experimenting with different sizes of by screen numbers and number of sources in the app. I found something was multiplying thing unexpectedly. If I had just one video screen and 200 video sources or vice versa, it was fine. But as I started doing multiple video screens and multiple video sources, object counts would rapidly increase.
I have another window I can load in my app that the user can choose that gives more of a grid style overview using a listbox. That window loaded just fine with over 100 video screens and 80 video sources. Object counts were high but in the hundreds not thousands. So something was wrong with just the one window.
While I was half asleep early this morning, the answer came to me! It was the menus! When the custom control I created for each screen was initialized, I would create the menu as a property of the control. So each menu is an object and each item in the menu (they are also menu items) are objects. And every single control has basically the same menu. There’s the multiplication I was seeing! So I tested out my theory by disabling the menu creation and sure enough, I could load large numbers of both screens and source items and object counts were in the 100s. Nowhere near 10,000.
I’ve spent about 90 minutes now changing my code to create the menu 100% dynamically and on the fly. I don’t store it at all any more - no need to. It’s fast enough to create it as I go.
Problem solved…