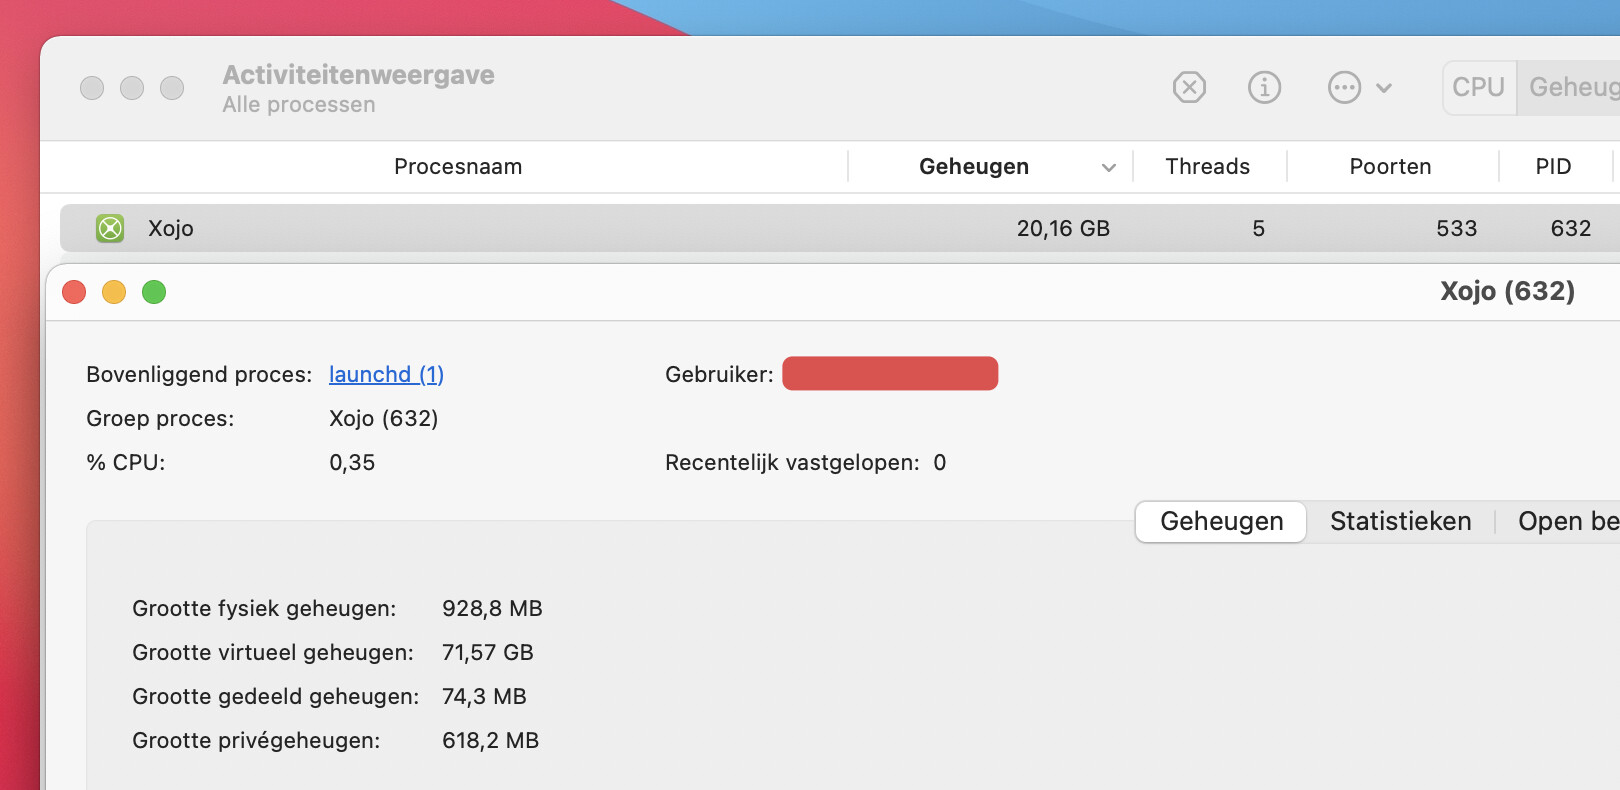
Why is this never cleaned, it’s always growing. It also seems to slow down the ide tremedously the bigger the number (ing GB) the slower everything becomes.
Just compile alot of times, the value will keep growing forever… in 10 minutes i’m a 16GB virtual memory… keeps growing still…
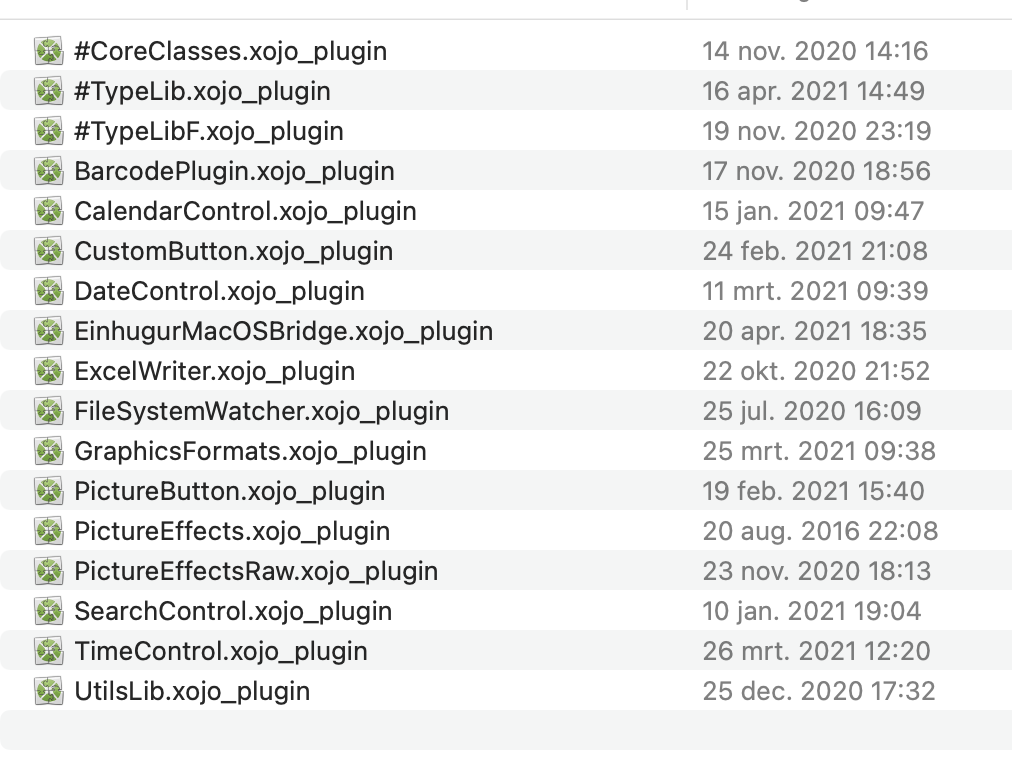
Yes i use plugins, yes i compile alot. No i’m not gonna quit xojo after every compile.
Xojo should simply cleanup caches automaticly that are never to be used again if it’s such cache that is showing.
The ide becomes slower and slower if the value is higher… and it seems to use more and more disk activity…
By default i save alot CMD+S so it may have something to do with it.
FWIW, I’m seeing nothing like that on 2021R1.1. I only have the Einhugur (free) TypeLib and MBS Util and Graphics Magic plugins installed, though none of them are being used on the current project.
I wonder if it has to do with your plugins? Maybe try removing them one at a time to see if you can isolate?
Here’s what my memory usage looks like (iMac Intel 6-core i7, w/8GB RAM)
Remember you can always grab Plugins Pro to try and help manage your plugins
Enable and disable plugins or sets without uninstalling, check for updates, all the good stuff.


 .
.