Example:
a(3) and b as integer / defined in a module (global)
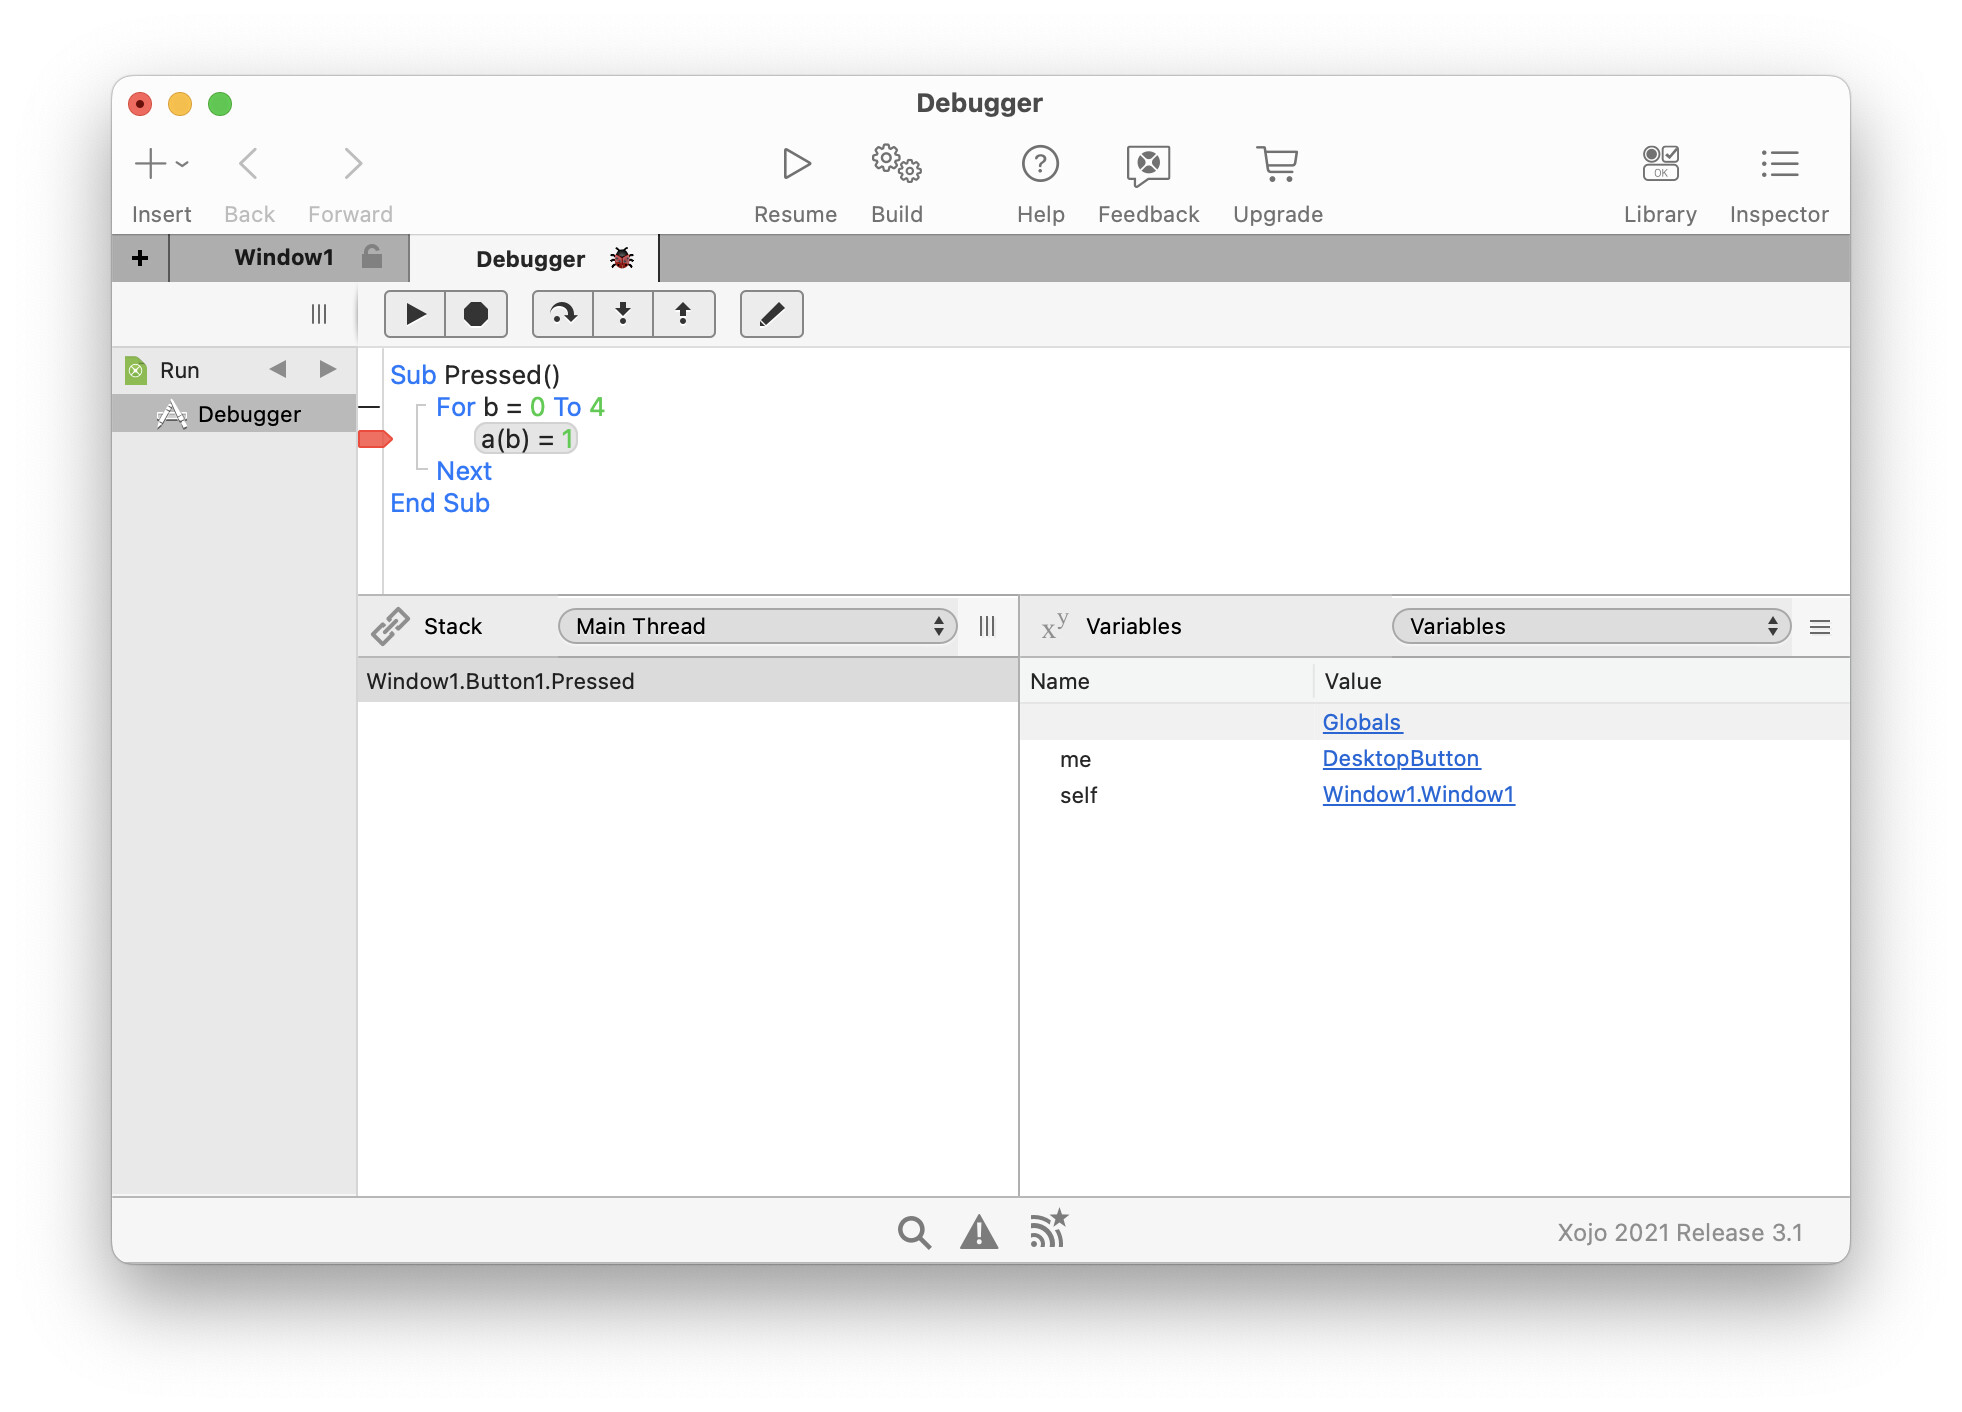
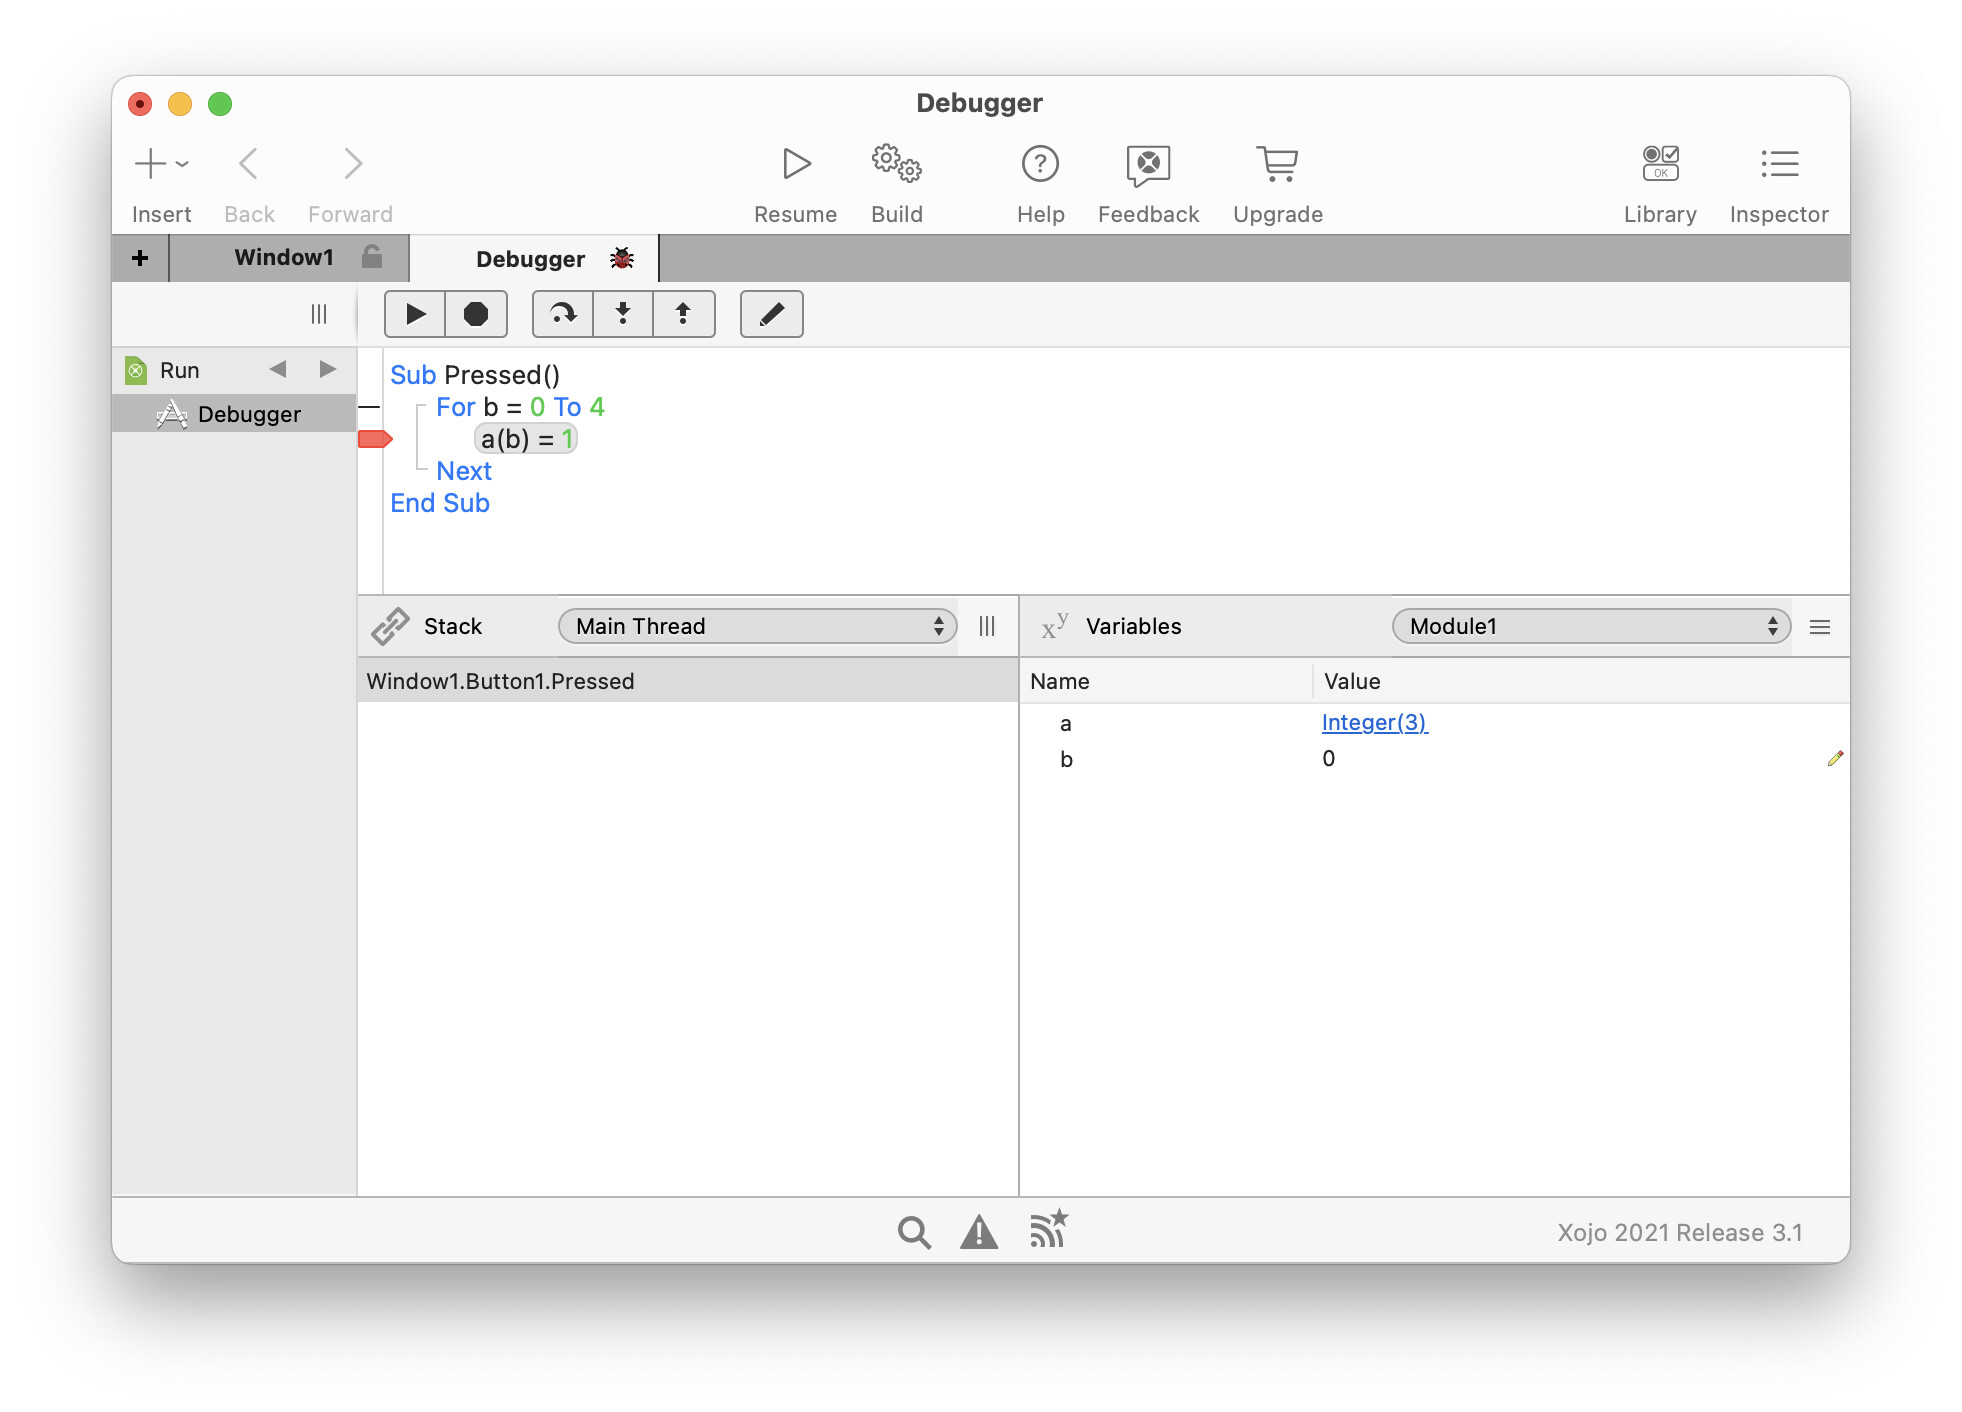
For b = 0 To 4
a (b) = 5
Next b
In the most of cases the debugger shows little or useless information, like in this case (exception), but no value. On VB6.0 i hoover over the variables and get b = 4. On Xojo i get nothing.
My way is to write the values in the title. But it’s a torture if a lot of values are in use.
Is there a hidden switch for “unhide debug informations”?
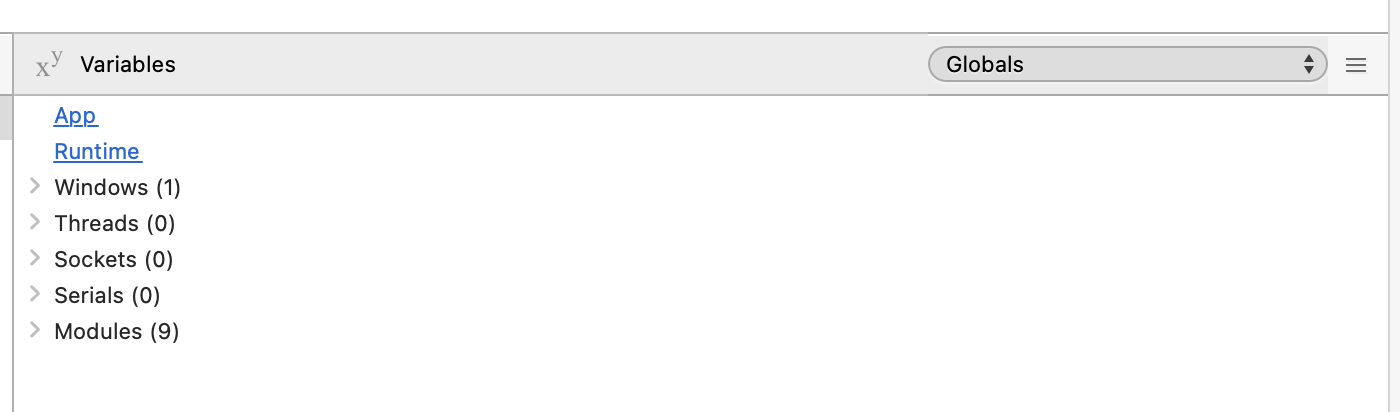
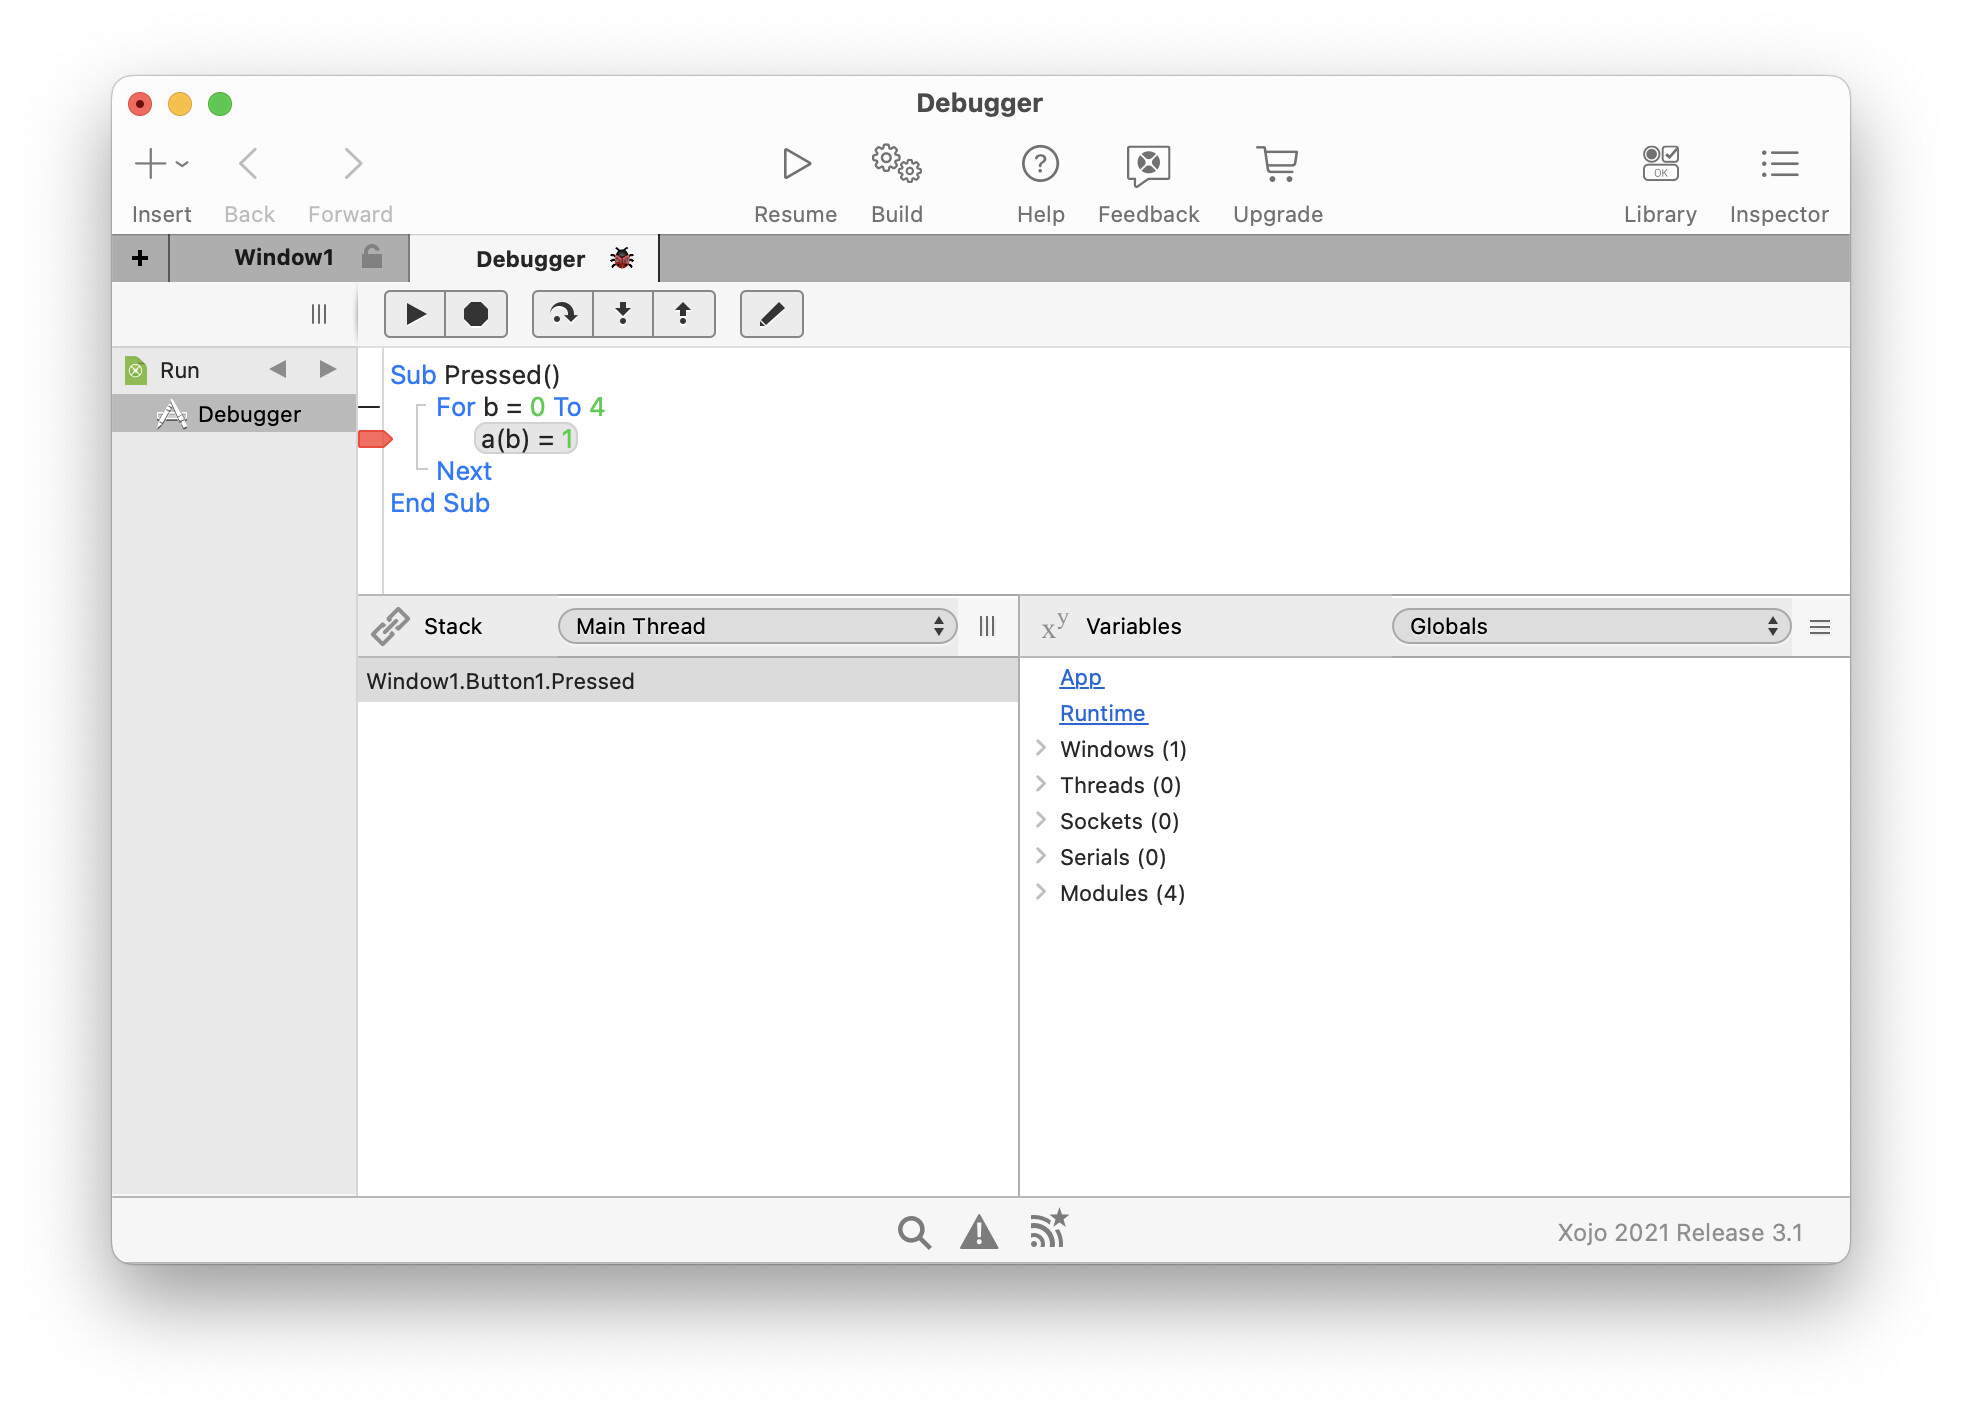
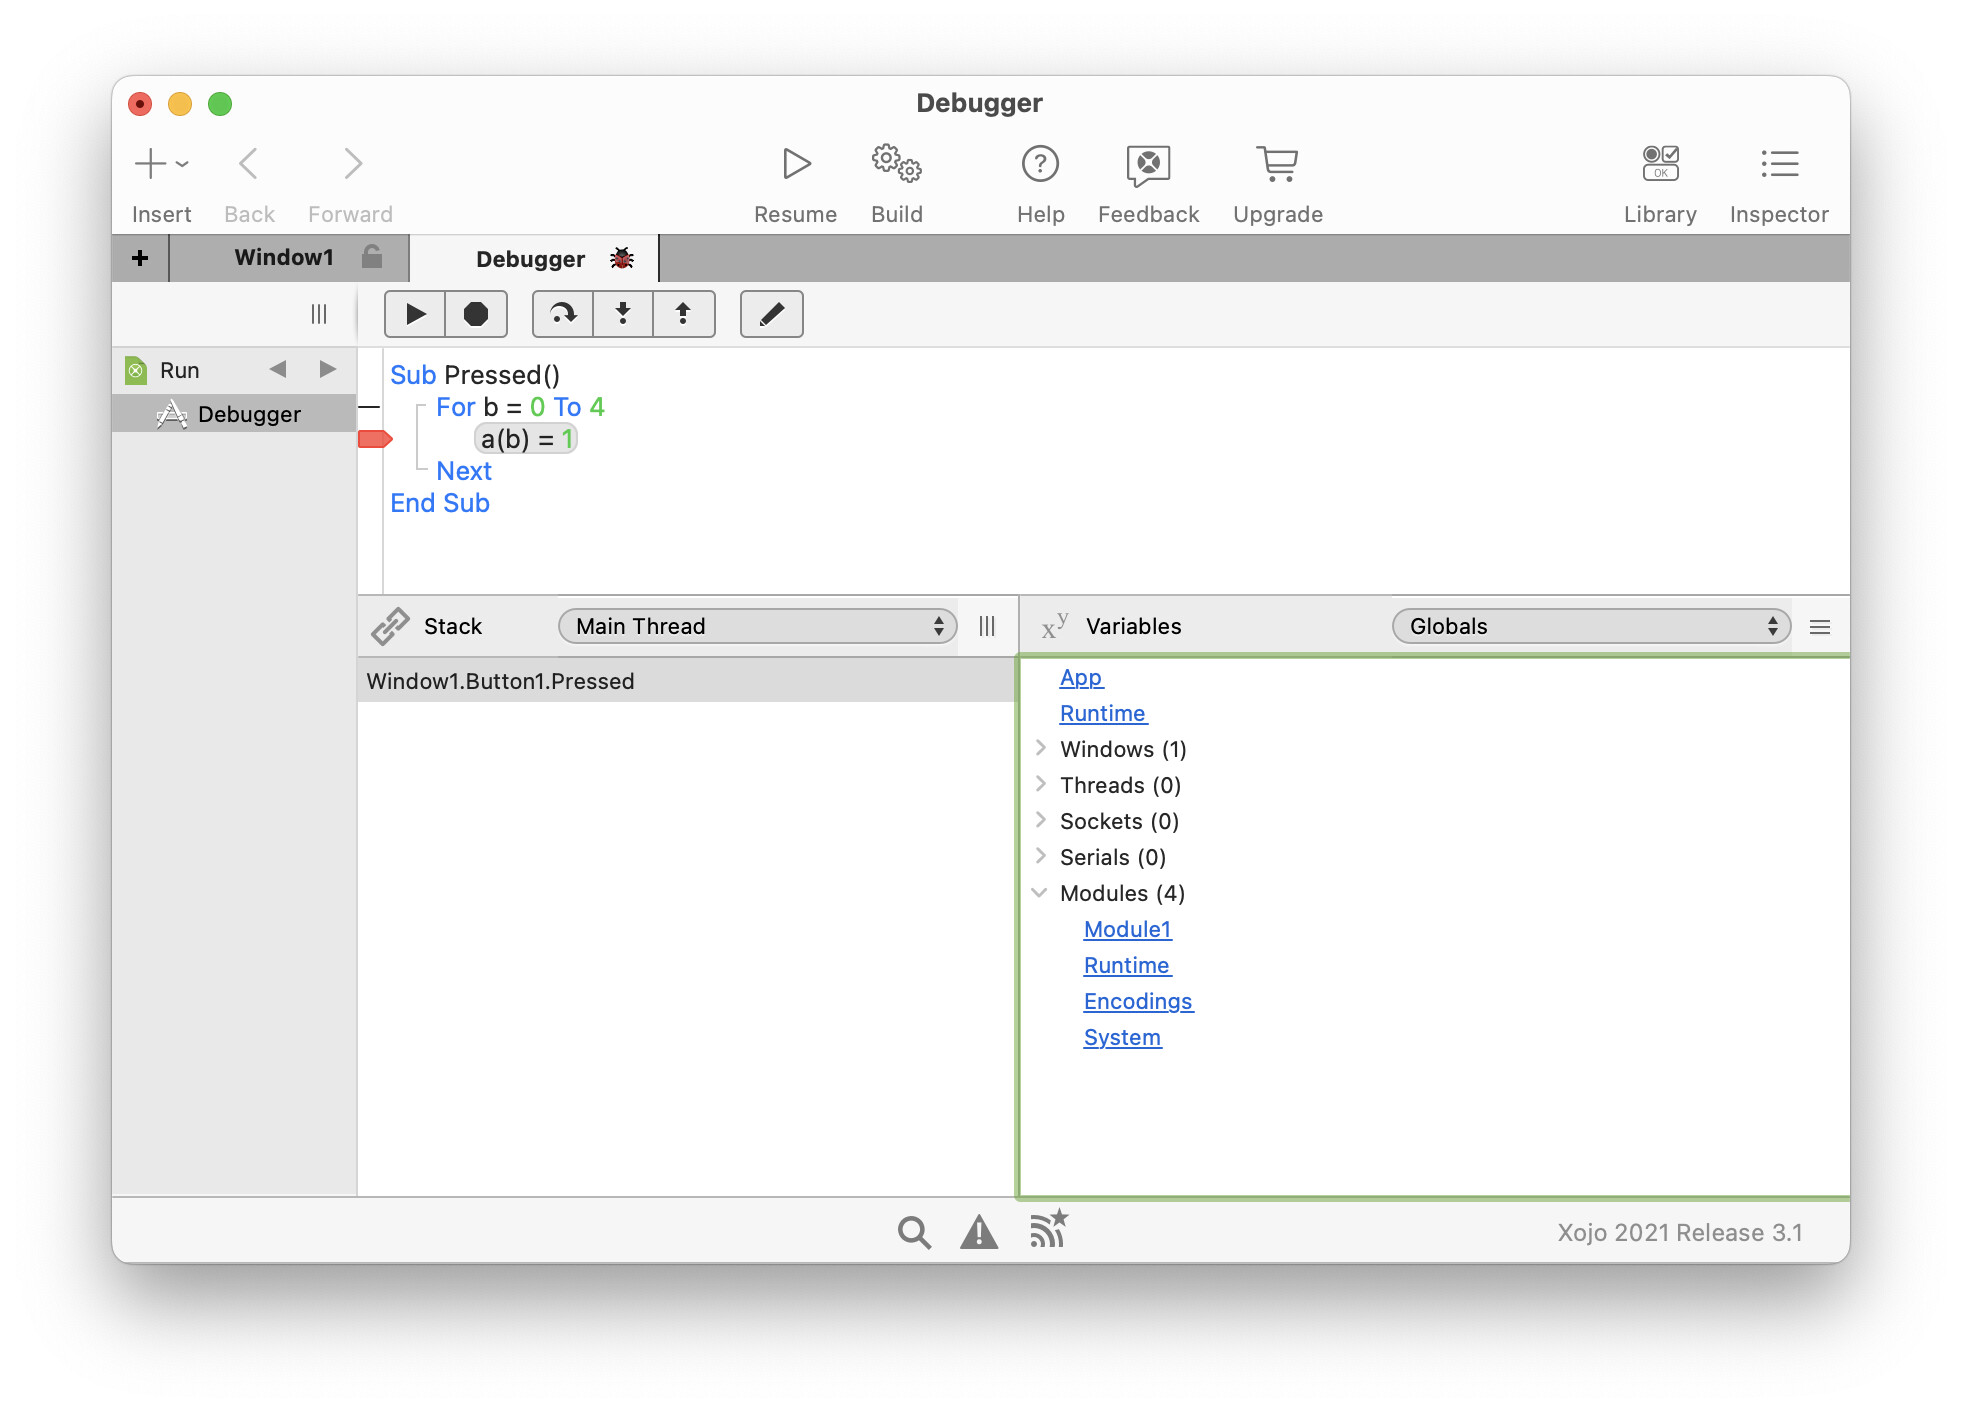
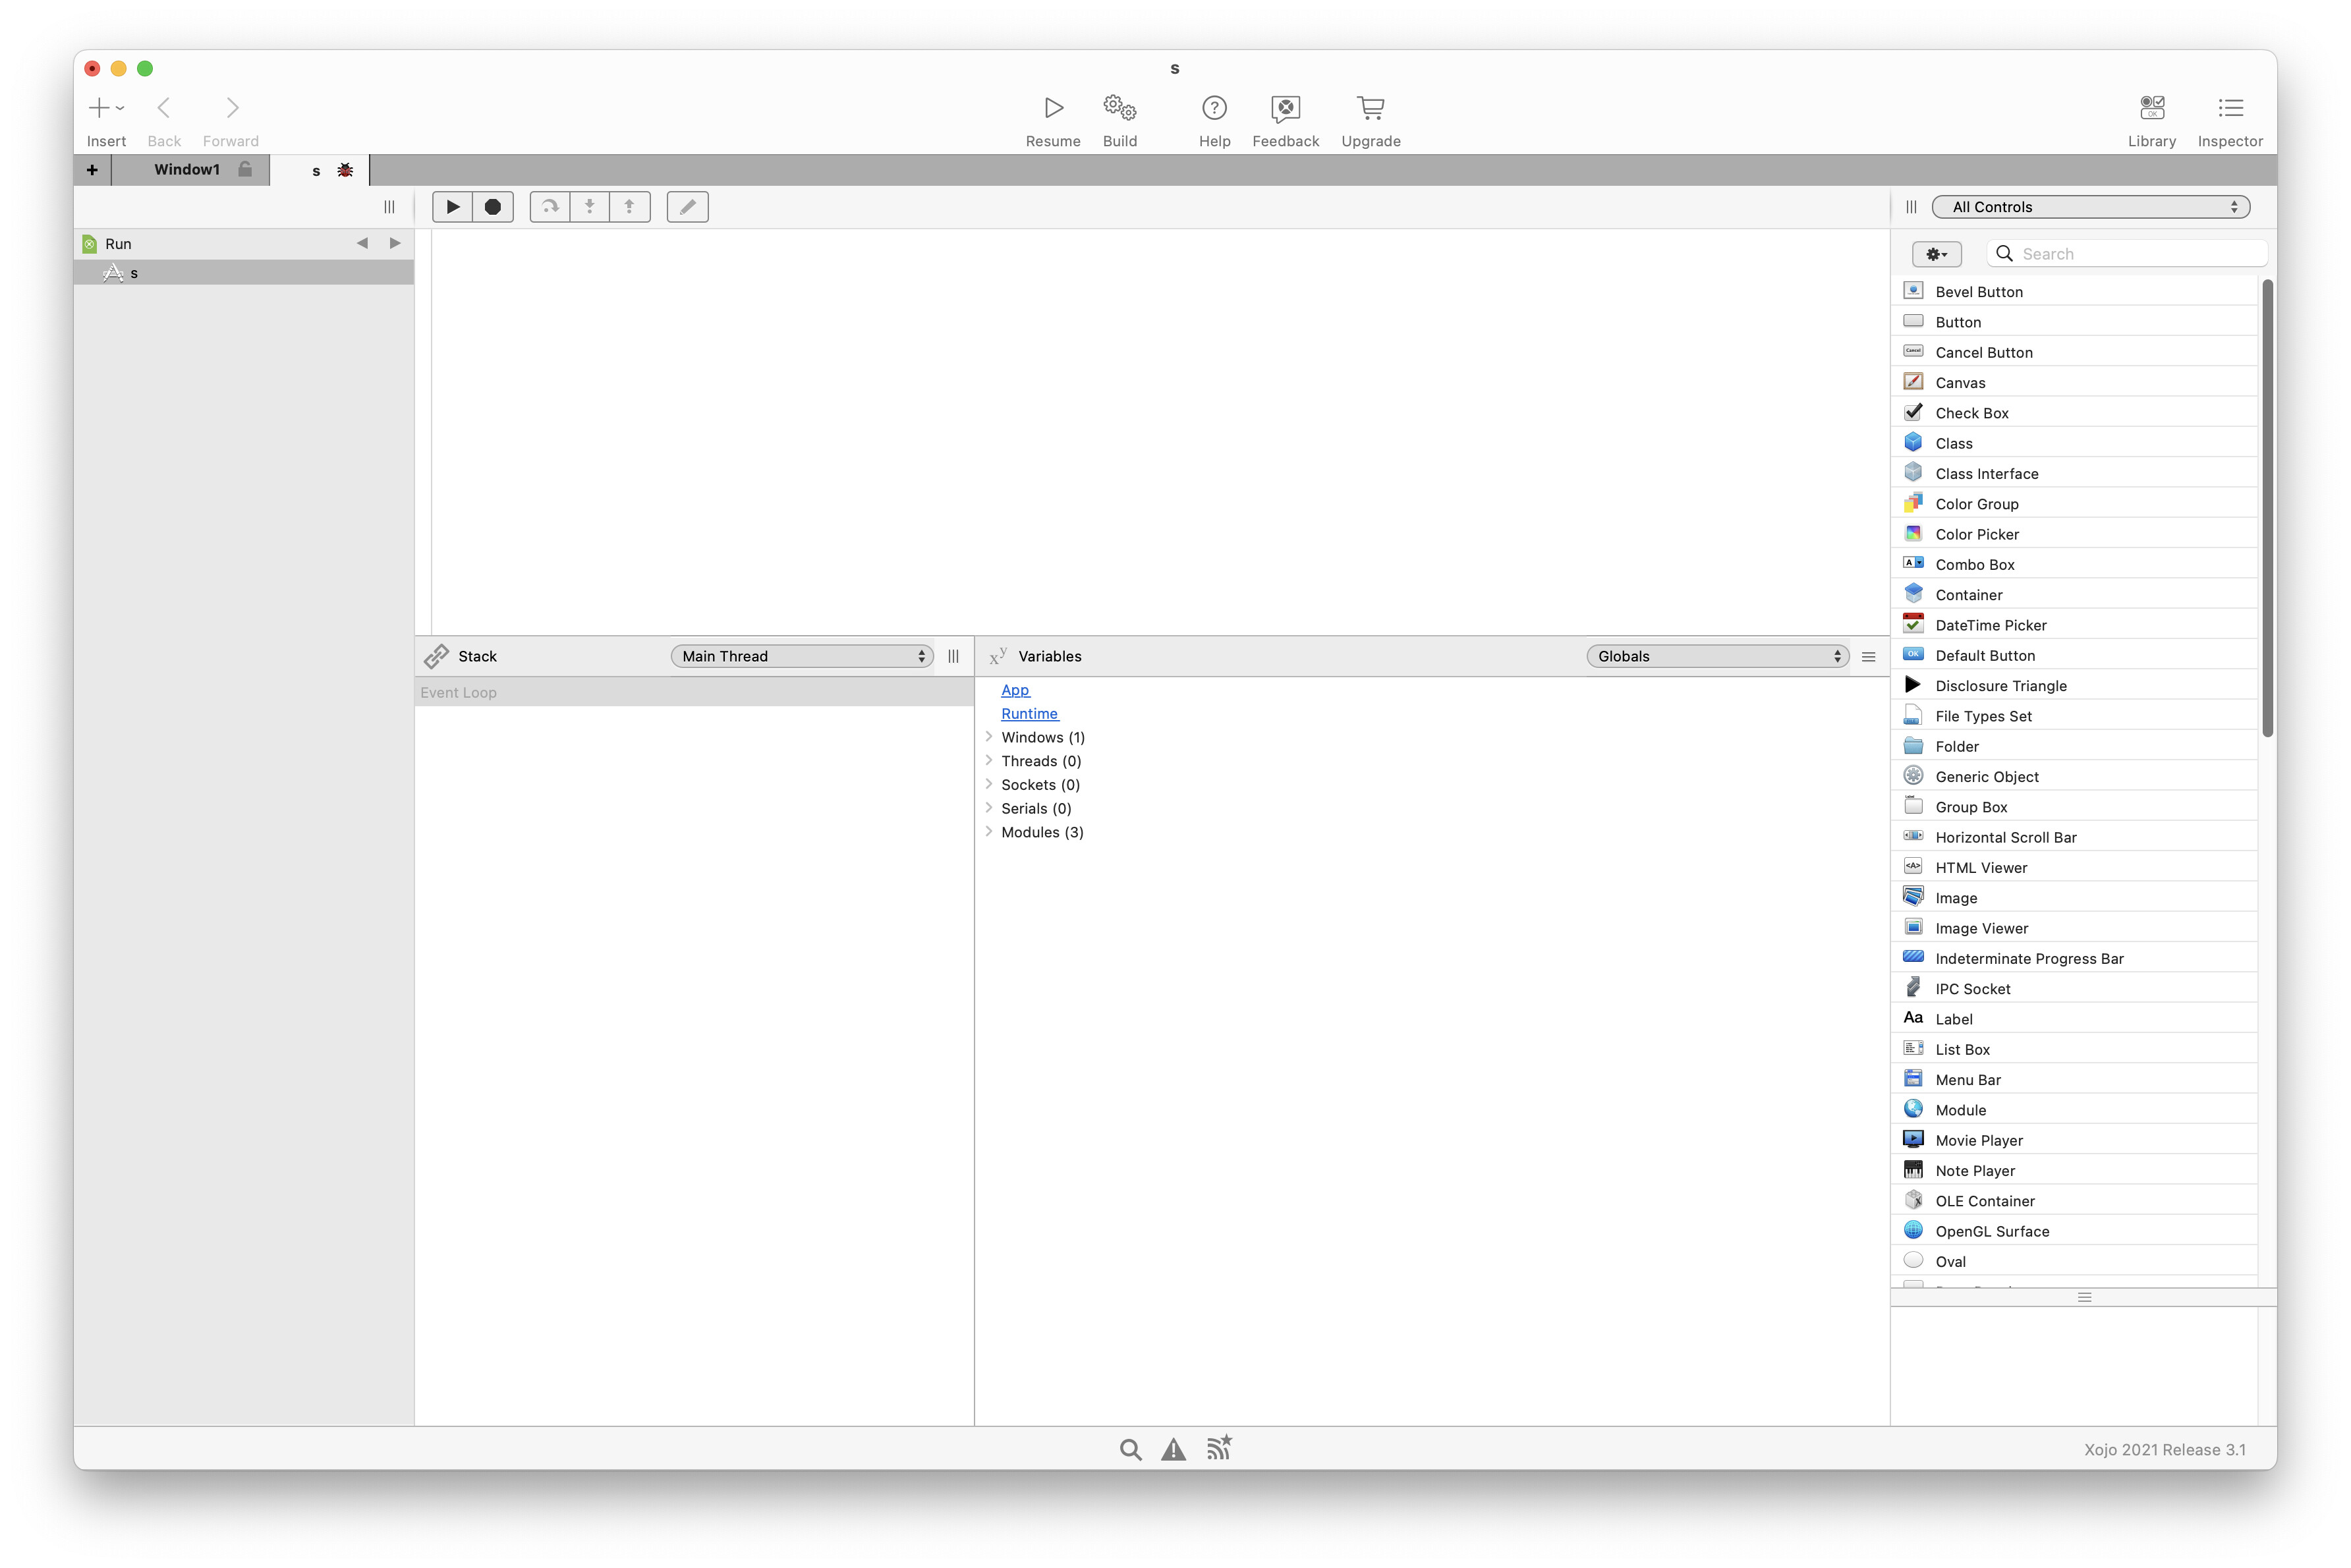
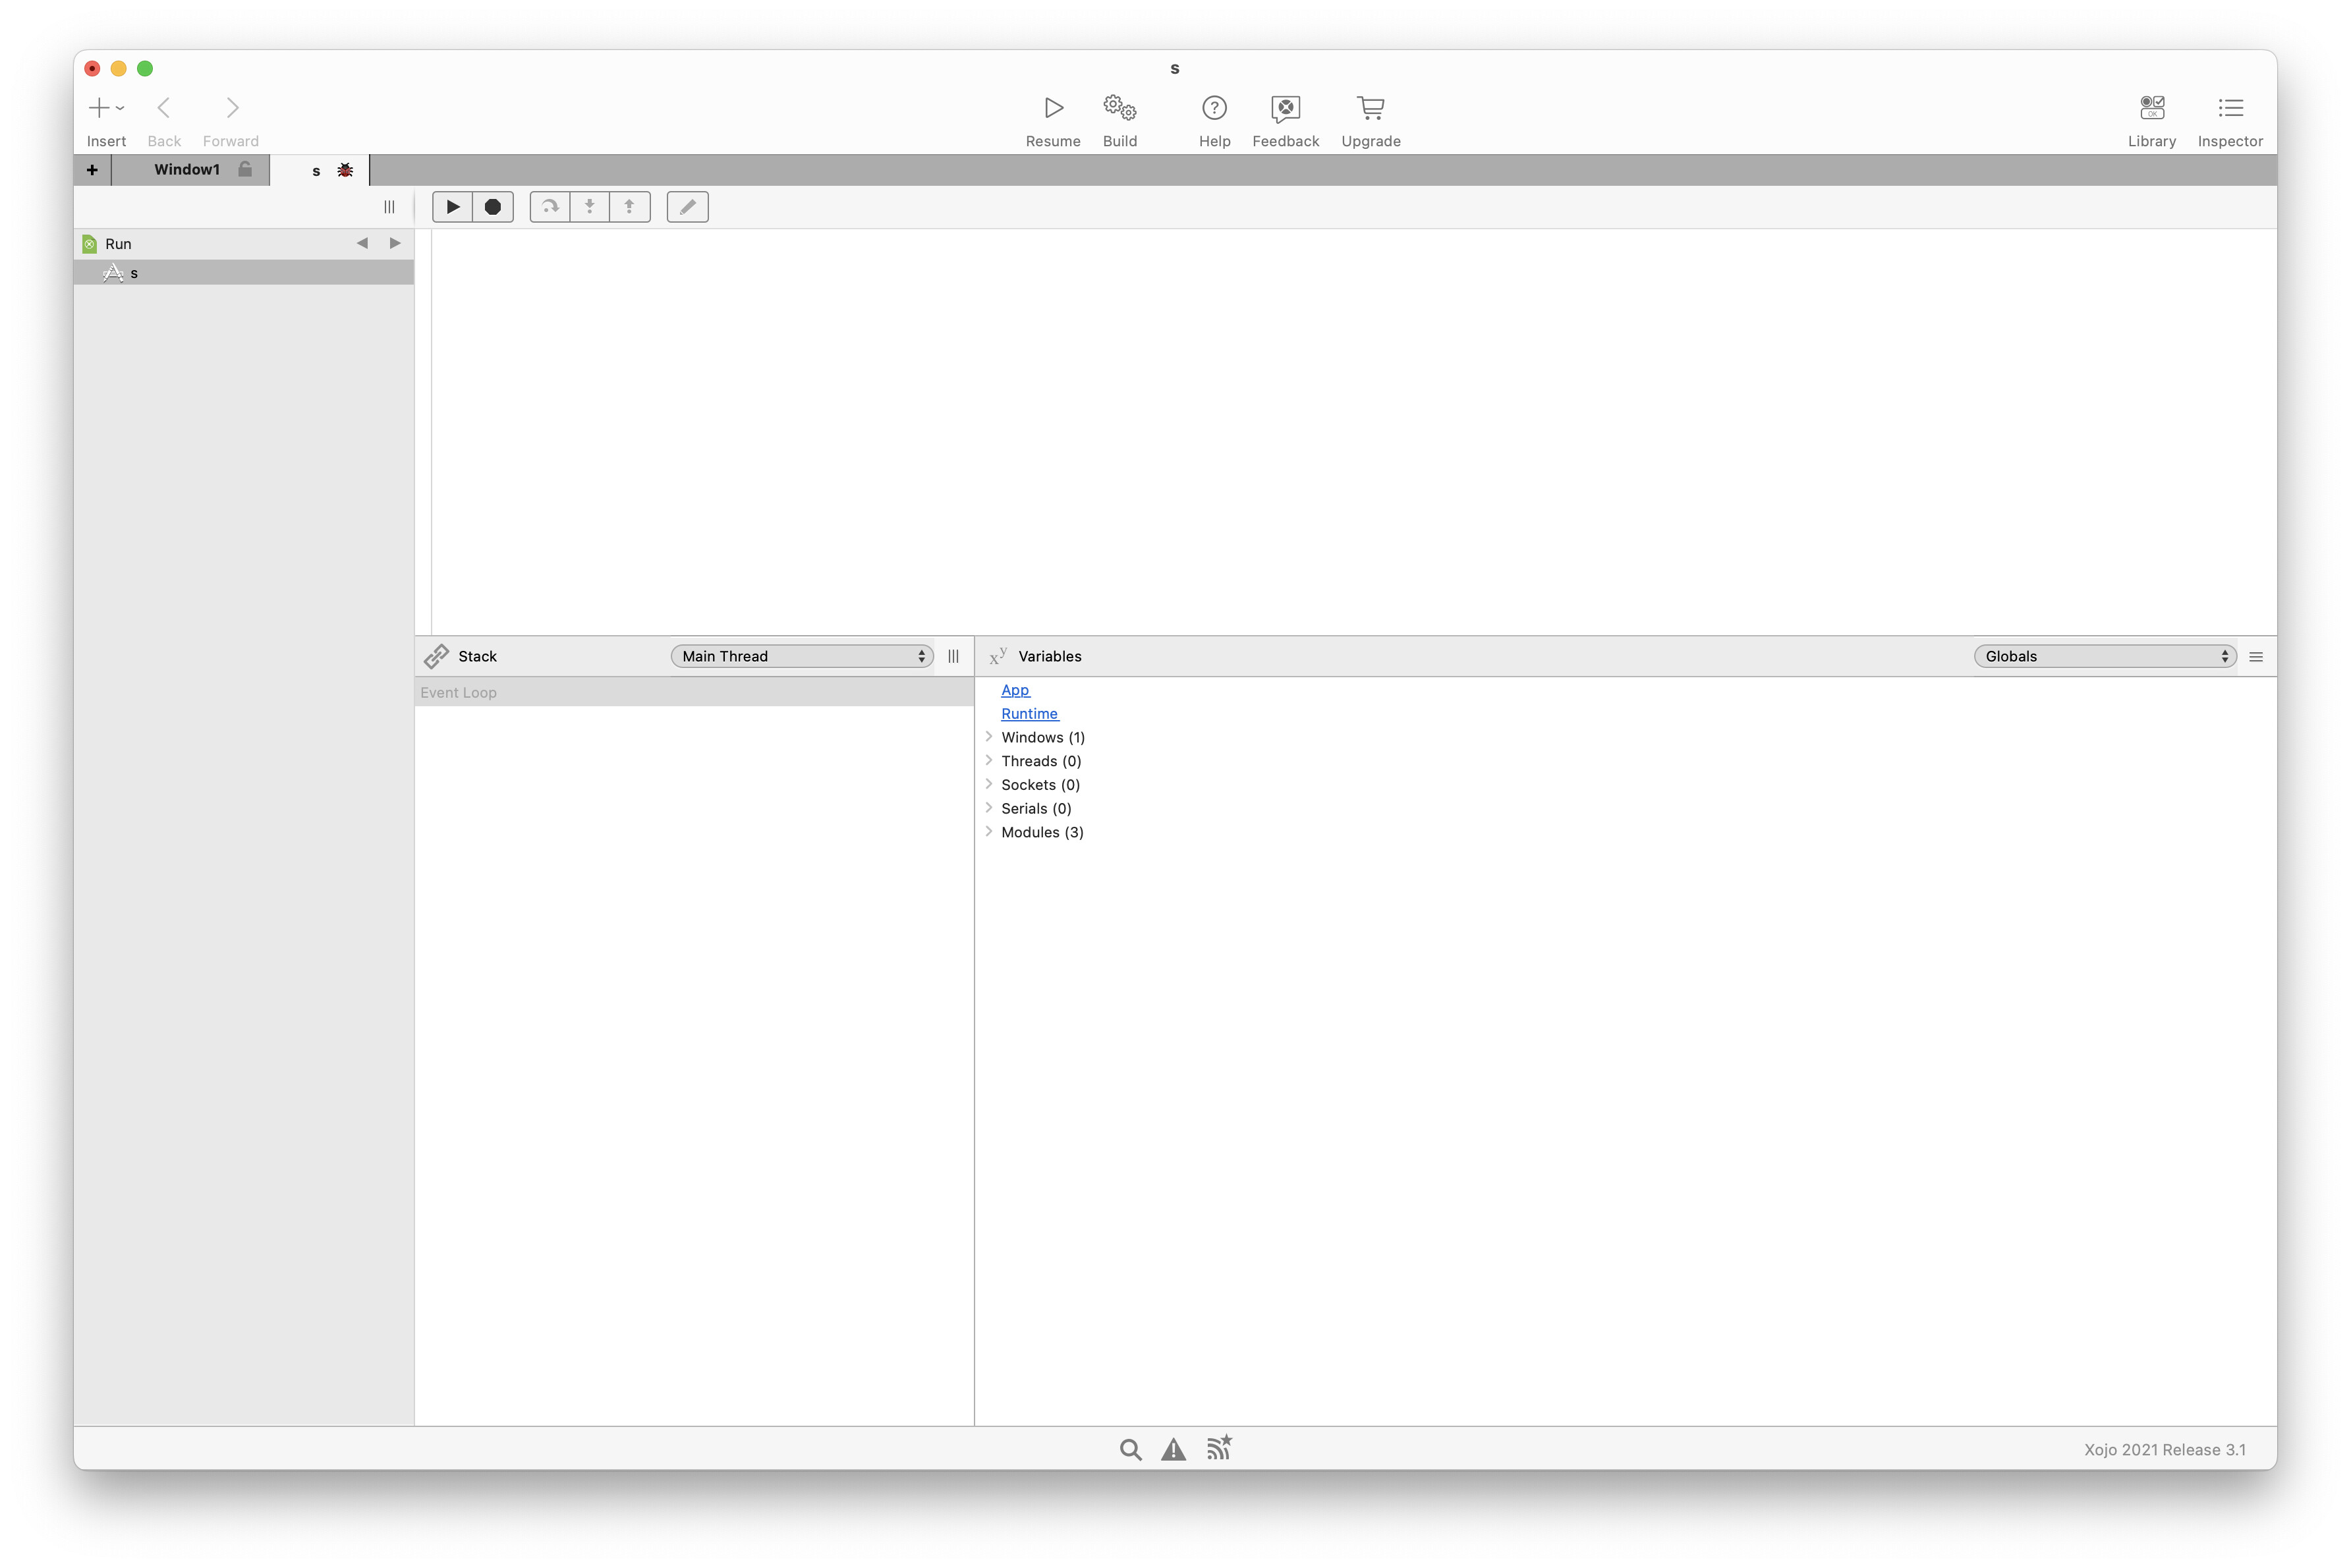
Every variable is available in the debugger. If you want to see globals you have to open the globals. If you want to see modules you need to look in modules. Could it be better, yes very much so, however, it does show everything, if you look in the right place.
My request for Watch points is number 2 in feedback (yes, it now says Vanessa Gregory, but that is because I retired and she took over my account). I would love to see some improvements. <https://xojo.com/issue/1095>
If you can’t tell us what the problem is how do you expect us to understand your problem? Yes, the design of the debugger is a bit odd. But all values are there.
Honestly, I love Xojo, but sometimes I hate it because very simple problems can only be solved with hours of internet research.
The debugger MUST solve problems, not create them. If several linked parameters that were declared in different modules cannot be found in the debugger after a minute’s search, I write the values in the title line. Then the debugger is useless.
Ok, now i understand. I thought the debugger shows the error. In reality i have to search for.
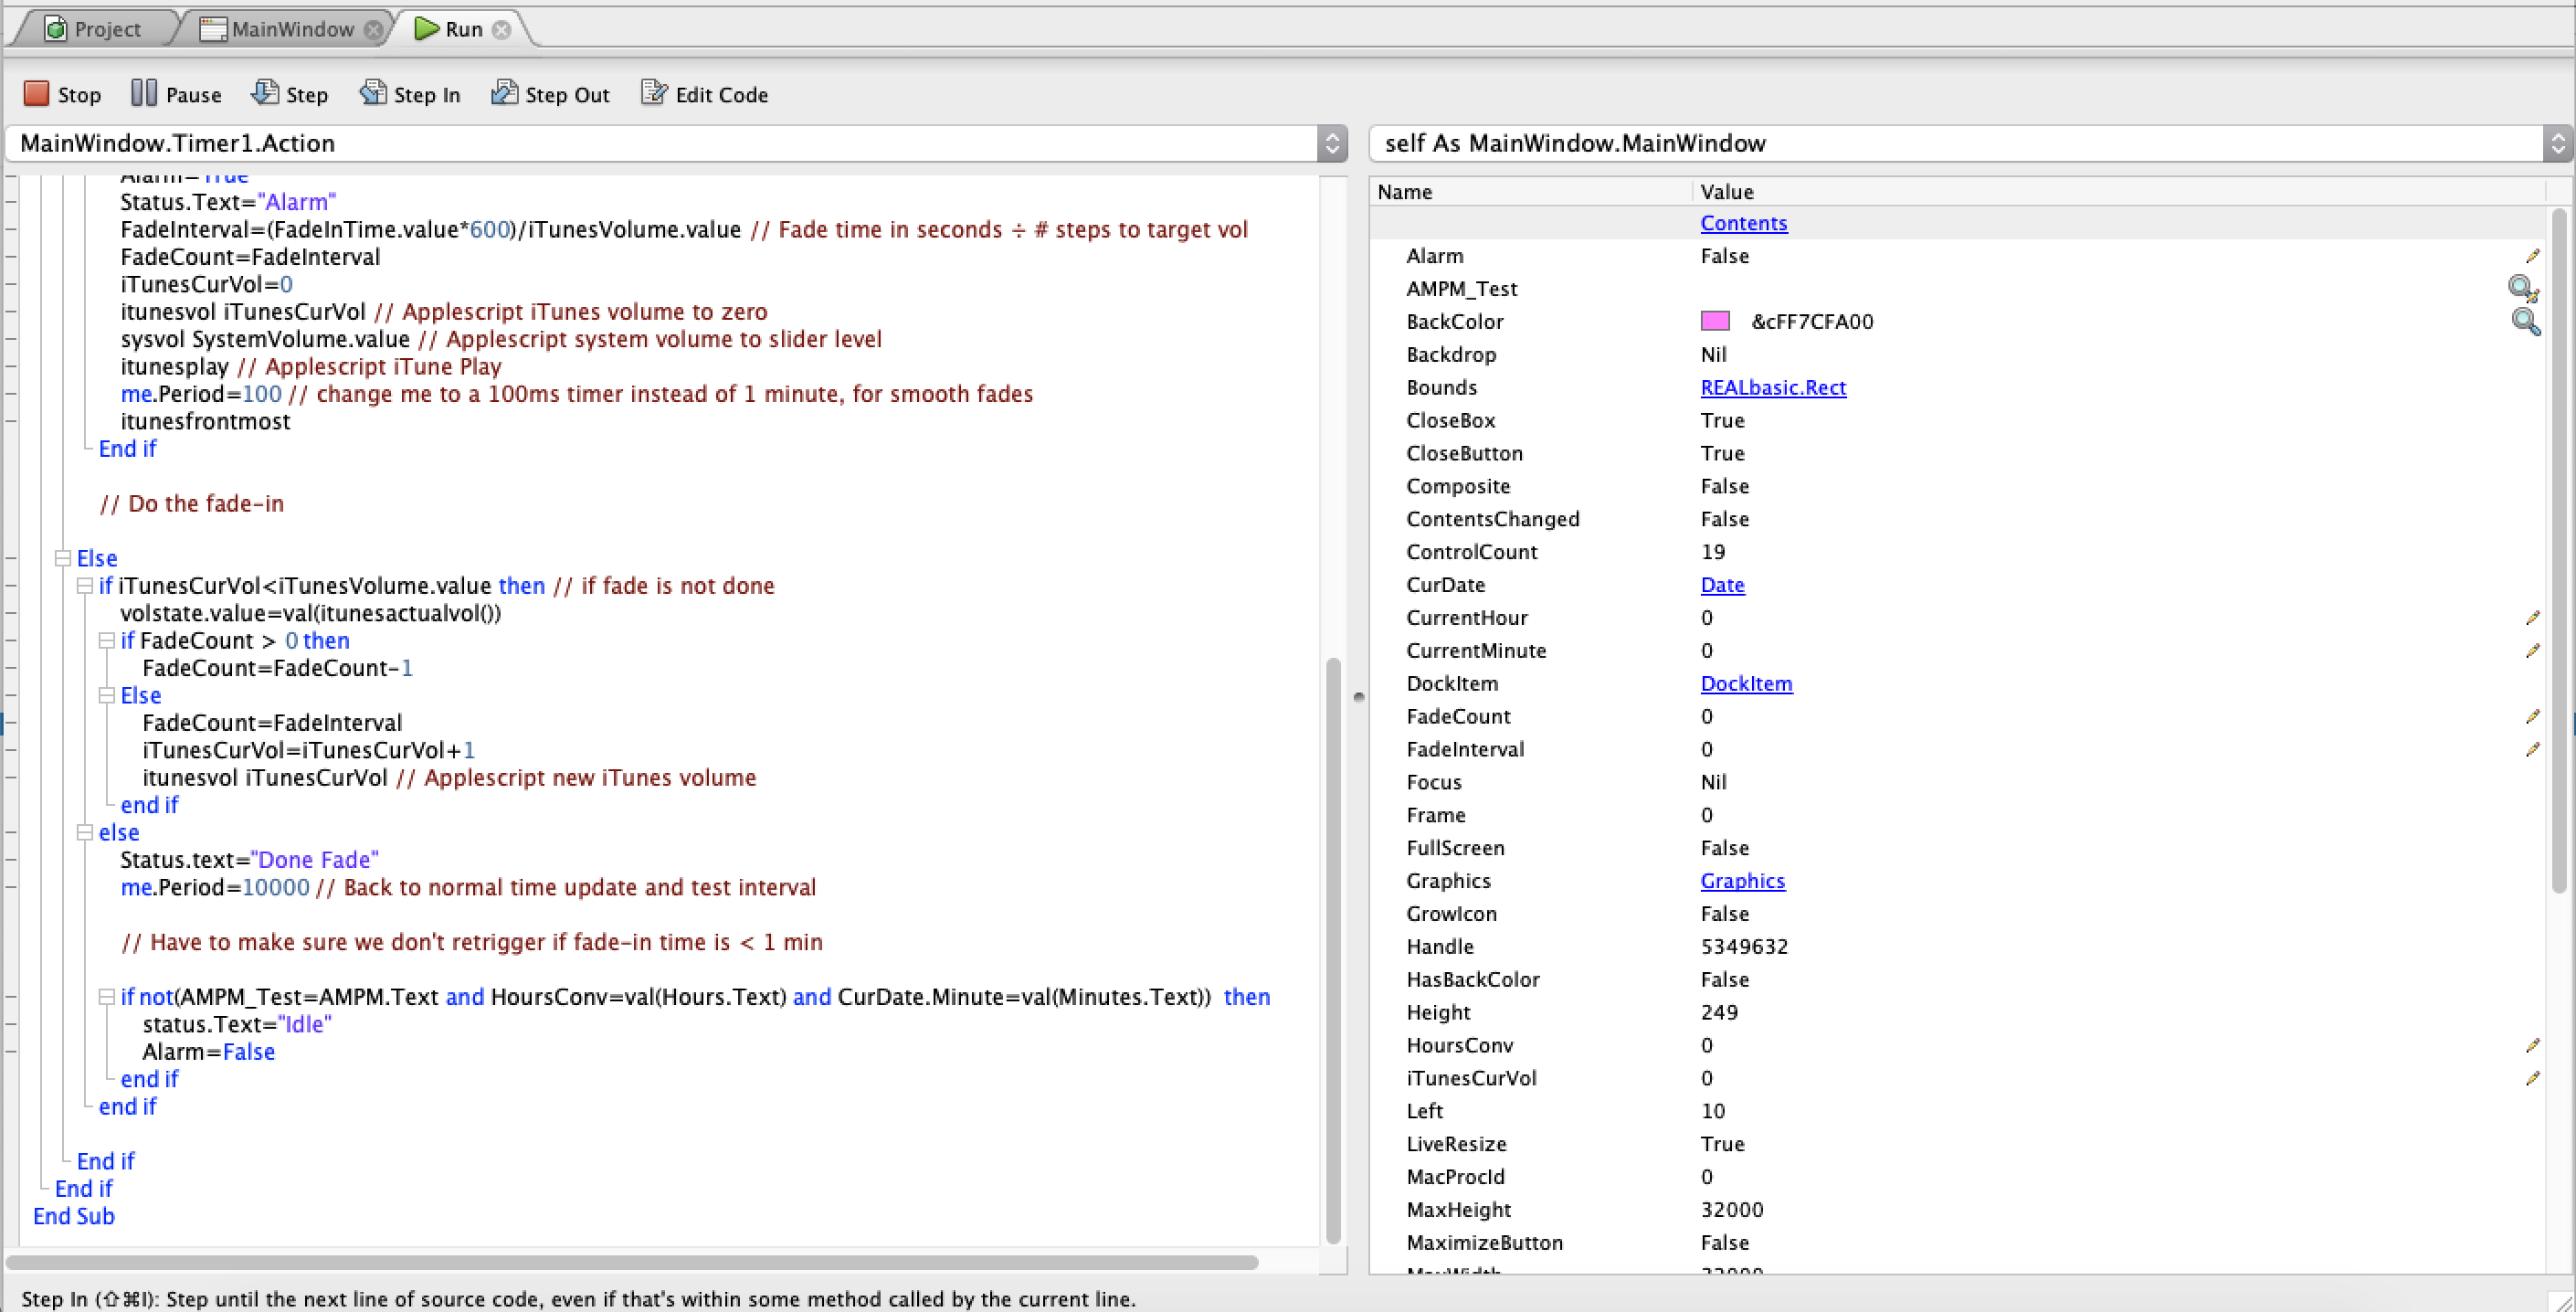
(If i use complex values with arrays, the debugger search in different modules is time consuming.)
I use the title bar… that is fast and precise.
I understand; you reset the window size and enlarge the debugger part to not place too large images, but they are a bit misleading.
In fact, the debugger have to be a tear off… If it can be displayed in its own window (remember large screen is everywhere nowadays just like multi screens), it will be far easier to debug projects and continue to code / modify the code…
The point was to show the data, however, this is a full window from my MacBook Pro 16" with the debugger variables area as large as it can be. It doesn’t seem too unreasonable.